From David Ruccio Most Americans are not loading sixteens tons of coal. But they are, even in the midst of the recovery from the Second Great Depression, sinking deeper and deeper into debt. According to a recent analysis by Reuters [ht: ja], the bottom 60 percent of income-earners have accounted for most of the rise in consumption spending over the past two years even as their finances have worsened.* The data show the rise in expenditures has outpaced before-tax income for the lower 40 percent of earners in the five years through mid-2017, while the middle 20 percent has just about stayed even. However, the upper 40 percent—especially the top fifth—has increased its financial cushion, deepening income inequality and leaving those at the bottom in an increasingly precarious financial
Topics:
David F. Ruccio considers the following as important: Uncategorized
This could be interesting, too:
tom writes The Ukraine war and Europe’s deepening march of folly
Stavros Mavroudeas writes CfP of Marxist Macroeconomic Modelling workgroup – 18th WAPE Forum, Istanbul August 6-8, 2025
Lars Pålsson Syll writes The pretence-of-knowledge syndrome
Dean Baker writes Crypto and Donald Trump’s strategic baseball card reserve
from David Ruccio
Most Americans are not loading sixteens tons of coal. But they are, even in the midst of the recovery from the Second Great Depression, sinking deeper and deeper into debt.
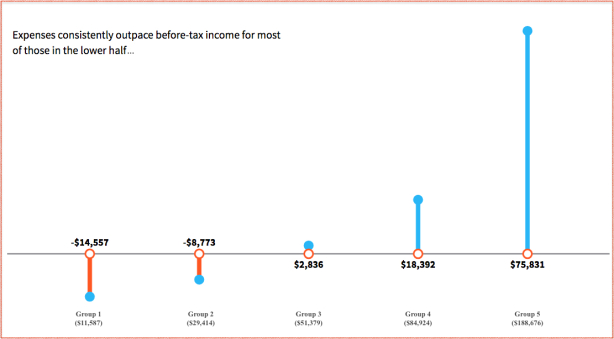
According to a recent analysis by Reuters [ht: ja], the bottom 60 percent of income-earners have accounted for most of the rise in consumption spending over the past two years even as their finances have worsened.* The data show the rise in expenditures has outpaced before-tax income for the lower 40 percent of earners in the five years through mid-2017, while the middle 20 percent has just about stayed even. However, the upper 40 percent—especially the top fifth—has increased its financial cushion, deepening income inequality and leaving those at the bottom in an increasingly precarious financial position.**
It is this recovery’s paradox.
A booming job market and other signs of economic expansion encourage rich and poor alike to spend more—to pay for transportation and housing, put their kids through college, to cover medical bills—but the combination of rising prices and stagnant wages for most middle-class and lower-income Americans means they need to dip into their savings and borrow more to do that.***
In other words, the U.S. economy relies on individual consumption to sustain the economic recovery but doesn’t pay most Americans enough to cover their expenditures without going into debt.
What that means, of course, is that in 2017 many Americans—71 million (or 31.6 percent of adults with credit records), according to the Urban Institute—had debt in collections, thus putting their financial futures at risk.
It also means that many Americans are reaching retirement age in worse financial shape than the prior generation, for the first time since Harry Truman was president. According to the Wall Street Journal,
They have high average debt, are often paying off children’s educations and are dipping into savings to care for aging parents. Their paltry 401(k) retirement funds will bring in a median income of under $8,000 a year for a household of two.
In total, more than 40% of households headed by people aged 55 through 70 lack sufficient resources to maintain their living standard in retirement. . .That is around 15 million American households.
Finally, it means that the United States is heading for a level of income inequality that hasn’t been seen since 1928. Already, the richest residents in fives states and 30 cities have surpassed that threshold.
According to the Economic Policy Institute,
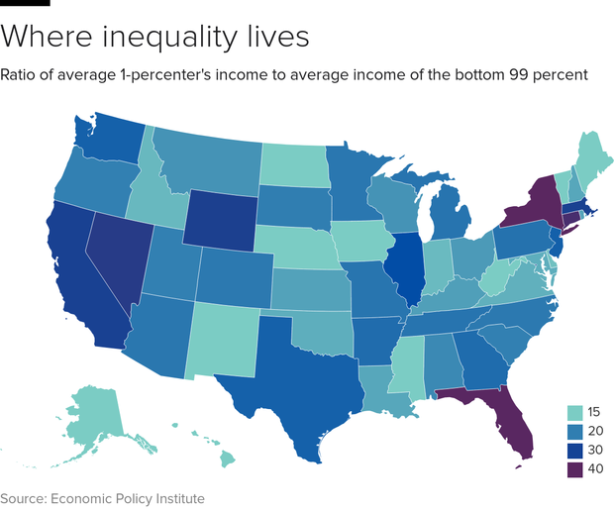
Income inequality has risen in every state since the 1970s and, in most states, it has grown in the post–Great Recession era. From 2009 to 2015, the incomes of the top 1 percent grew faster than the incomes of the bottom 99 percent in 43 states and the District of Columbia. The top 1 percent captured half or more of all income growth in nine states. In 2015, a family in the top 1 percent nationally received, on average, 26.3 times as much income as a family in the bottom 99 percent.
In the most unequal states—New York, Florida, and Connecticut—the top 1 percent had average incomes more than 35 times those of the bottom 99 percent!
Merle Travis had it right. But these days, the iconic American worker isn’t loading sixteen tons of number nine coal—although they may be packing and shipping the equivalent in Amazon goods. Nor do they owe their soul to the company store—just to the employers who pay them so little and the sellers (of housing, cars and trucks, their children’s education, and healthcare) whose prices keep rising.
As a result, most Americans are either just getting by or finding themselves deeper in debt, falling further and further behind the tiny group at the top. All the while they, like their coal-mining predecessors, are imploring St. Peter not to call them ’cause they just can’t go.
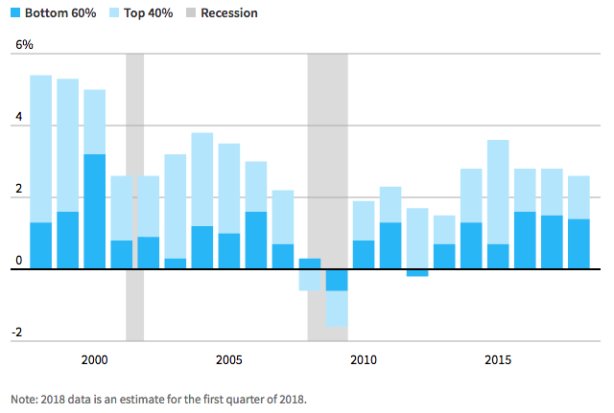
*The top 40 percent of earners usually drive U.S. consumption growth. But 2016-17 was the first two-year span in at least two decades that the bottom 60 percent accounted for about half of the growth in consumption, and that appears to have continued in the first quarter of 2018.
**The Reuters study divides Americans into five groups based on their median before-tax income, as illustrated in the chart at the top of the post.
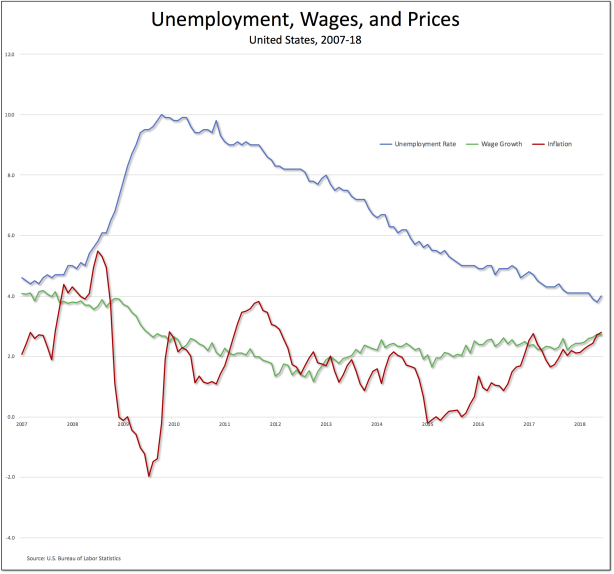
***Even as the official unemployment rate (the blue line in the chart below) has plummeted, workers’ wages (the green line, for production and nonsupervisory workers) have barely stayed ahead of inflation (the red line, for the Consumer Price Index) in recent years.
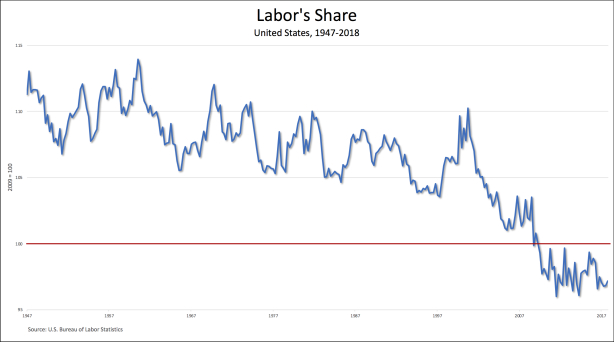
The result is a precipitous decline in the labor share of national income, which remains perilously close to its lowest level in 50 years:

