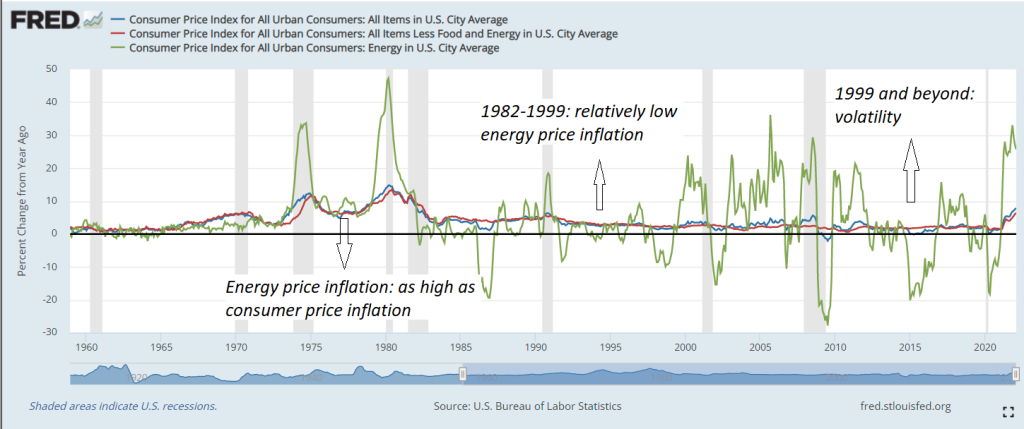
At this moment, retail energy prices (prices paid by consumers and companies for final use of energy) are, compared with other consumer prices, rising fast. Has this happened before? Yesterdays post shows that in the EU and since 2006 the rise is exceptional. But what shows when we look further back in time? For reasons of convenience and because the USA data stretch back to 1960 while the EU data only stretch back to 1997 I’ve tinkered a little with USA consumer price data. The answer to the question is clear: it has happened before – but the present spell of high energy price inflation (30+% a year) is starting to last exceptionally long. This answer leads to other questions: does, in a historical perspective, the present spell of energy price inflation also lead to a relatively
Topics:
Merijn T. Knibbe considers the following as important: Uncategorized
This could be interesting, too:
tom writes The Ukraine war and Europe’s deepening march of folly
Stavros Mavroudeas writes CfP of Marxist Macroeconomic Modelling workgroup – 18th WAPE Forum, Istanbul August 6-8, 2025
Lars Pålsson Syll writes The pretence-of-knowledge syndrome
Dean Baker writes Crypto and Donald Trump’s strategic baseball card reserve
At this moment, retail energy prices (prices paid by consumers and companies for final use of energy) are, compared with other consumer prices, rising fast. Has this happened before? Yesterdays post shows that in the EU and since 2006 the rise is exceptional. But what shows when we look further back in time? For reasons of convenience and because the USA data stretch back to 1960 while the EU data only stretch back to 1997 I’ve tinkered a little with USA consumer price data. The answer to the question is clear: it has happened before – but the present spell of high energy price inflation (30+% a year) is starting to last exceptionally long. This answer leads to other questions: does, in a historical perspective, the present spell of energy price inflation also lead to a relatively high level of energy prices?

Heuristically, the first graph suggests four different price ‘regimes’. A ‘regime’ has political and economic consonants which I will not spell out – I will restrict myself to the heuristics. The first is the period up to the oil crisis in 1973. The second is the 1973-1982 period. The third is the 1982-1999 period. And the fourth is the 1999-2022 (2020?) period. What happened to the relative price level in these periods? The second graph shows that energy prices:
- declined during the first period
- increased during the second period
- were quite low during the third period
- and were relatively high and quite volatile during the fourth period
Also, relative energy prices at this moment are not at a historical high and part of the present increase clearly is a cyclical recovery from the very low ‘Covid 19’ level just after 2000. The period after 1973 however shows that relative energy prices can stay long for quite some years – the volatility of the post 1999 decades may be over. This time, there might not be a downward swing. I do admit: large potential oil suppliers like Iran and Venezuela are still bridled (and Venezuela is a mess not just because of foreign intervention) – but that’s part of the present regime, which I won’t comment upon in this blog (oh, I just did…).

