From Blair Fix Have you ever wondered what it takes to become a billionaire? Do you need rare genius? Exceptional acumen? Miraculous foresight? An uncompromising work ethic? On all four counts, the answer is no. It turns out that to become a billionaire, what you really need is the right social setting. You need to live in a society that is suitably rich and appropriately unequal. Without those things, your chances of wearing the billionaire badge are low. In this post, I’ll do the math. Using data from Forbes, I’ll show you how the billionaire headcount varies across countries. Then I’ll show you how to predict this variation. Forget about character traits and personal histories. We don’t need them. To predict how many billionaires a country has, we can get surprisingly far just by
Topics:
Editor considers the following as important: Uncategorized
This could be interesting, too:
tom writes The Ukraine war and Europe’s deepening march of folly
Stavros Mavroudeas writes CfP of Marxist Macroeconomic Modelling workgroup – 18th WAPE Forum, Istanbul August 6-8, 2025
Lars Pålsson Syll writes The pretence-of-knowledge syndrome
Dean Baker writes Crypto and Donald Trump’s strategic baseball card reserve
from Blair Fix
Have you ever wondered what it takes to become a billionaire? Do you need rare genius? Exceptional acumen? Miraculous foresight? An uncompromising work ethic?
On all four counts, the answer is no.
It turns out that to become a billionaire, what you really need is the right social setting. You need to live in a society that is suitably rich and appropriately unequal. Without those things, your chances of wearing the billionaire badge are low.
In this post, I’ll do the math.
Using data from Forbes, I’ll show you how the billionaire headcount varies across countries. Then I’ll show you how to predict this variation. Forget about character traits and personal histories. We don’t need them. To predict how many billionaires a country has, we can get surprisingly far just by knowing the distribution of income.
The Forbes real-time billionaires list: A case study of enshittified data
I don’t usually start a post by lambasting my data sources. But in this case, I’ll make an exception. I’m about to use data that wreaks of capitalism. I’m speaking, of course, about the Forbes real-time billionaire list.

Backing up a bit, the über wealthy have immense control over our lives. So you’d think that these folks would be subjected to immense scientific scrutiny. But for the most part, they’re not. Instead, the best source of data on the über wealthy comes from the servants of power — groups like Forbes who make a buck by selling a list of capitalism’s greatest conquerors.
And I do mean selling.
Yes, you’re free to browse the Forbes real-time billionaire list and marvel at how the data gets updated by the second. But when you visit the page, you pay for your time with a barrage of eyeball-gouging ads.
In other words, the Forbes billionaire list is a case study of what Cory Doctorow calls ‘enshittification’ — the process of taking useful stuff and ruining it to make money. Yep, Forbes celebrates how billionaires enshittify society by enshittifying its billionaire-celebrating site with ads. A fitting irony.1
But now to business. However dubious the presentation may be, the Forbes billionaire data is of obvious importance. Fortunately, we can get a computer to clean the Forbes data, separating the billionaire wheat from the adware chaff. Having done that, I find myself with a scrubbed version of the Forbes billionaire list, gathered daily over the last few years.2
Let’s use this data to do some science!
Counting billionaires
The first thing I’ll do with the Forbes data is some basic population biology. Similar to how we can measure the concentration of E. coli in a sample of water, we can measure the concentration of billionaires in a sample of humans. Let’s do that at the country level.
Figure 1 shows billionaire counts per capita for 74 countries. (If a country is absent, that’s because Forbes says it currently has no billionaires.) Each point indicates the average number of billionaires per capita in 2021–2022. Horizontal lines show the billionaire range over that period.
What’s notable about this data is the spectrum of variation between countries. The concentration of billionaires varies over four orders of magnitude — from a high of 80 billionaires per million people in Monaco, to a low of 0.006 billionaires per million people in Bangladesh.
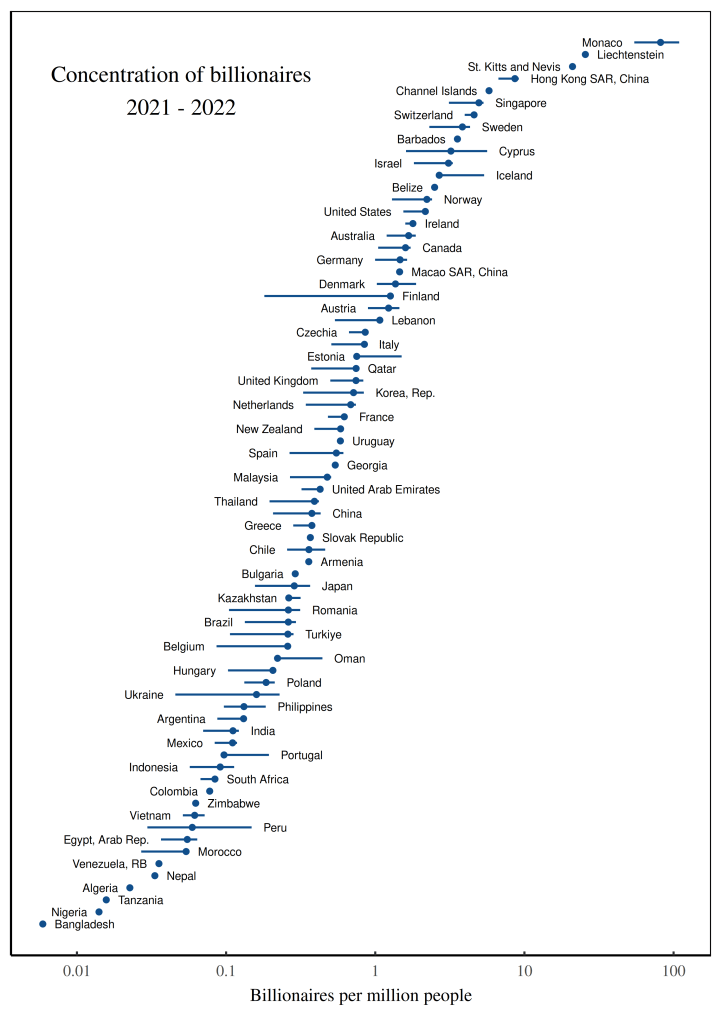
Now, if I was Forbes, I’d take this data and write a puff piece about why Monaco is so great because it has lots of billionaires, and how poor Bangladesh can’t get its act together. But I’m not Forbes. I’m a scientist. And what interests me is why some countries have lots of billionaires and other countries have few.
To unearth this explanation, we’ll head into the mathematical weeds of how wealth and income are distributed. But first, we’ll do something much simpler. It turns out that the billionaire headcount is determined in large part by a single quantity: a country’s average income.
More money, more billionaires
The figure of a billion dollars looms large in our minds, in part because it’s a big number. But to put this sum in perspective, a century ago, no one was talking about ‘billionaires’. Back then, if you were über rich, you were a ‘millionaire’.
Why the lower standard? Because a century ago, everyone had less money. So the threshold for being über rich had a lower dollar value.
The same principle holds across countries today. If you’re a billionaire in a wealthy country like Monaco, you’re certainly a rich person. But you’re not peerless. (Despite having just 36,000 citizens, Monaco has three Forbes billionaires.) However, if you’re a billionaire in a poor country like Bangladesh, in relative terms, you’re unimaginably wealthy. And so the billionaire club is proportionally smaller. (Bangladesh has 170 million people and just one Forbes billionaire.)3
To put this thinking into simple language, compared to poor countries, rich countries ought to have more billionaires.
When we look at the data, we find exactly this pattern. Figure 2 runs the numbers. As GDP per capita increases (horizontal axis), the billionaire headcount goes up (vertical axis). More money, more billionaires.
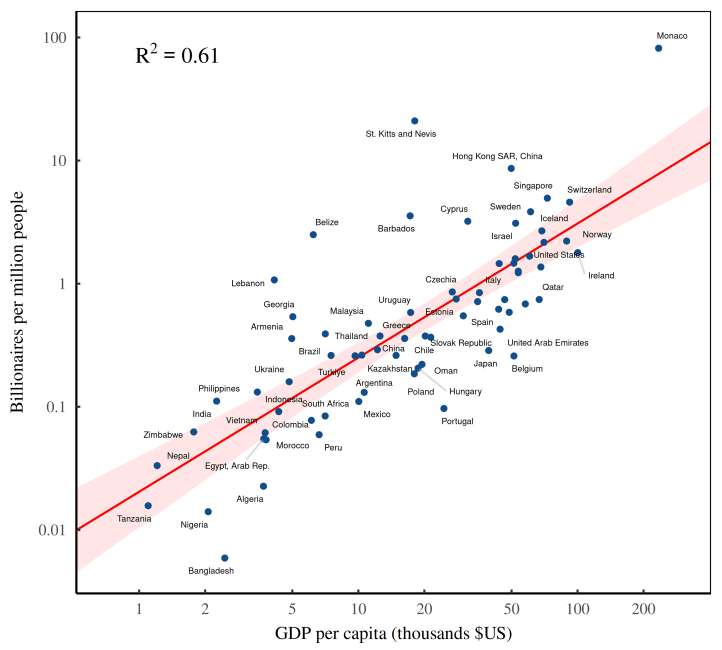
The caveat here is that I’m playing loose with the term ‘rich’. Technically, GDP per capita measures a country’s average income (a flow), while the Forbes list measures billionaires’ wealth (a stock). So when I say ‘more money, more billionaires’, the sticklers might protest that Figure 2 shows something slightly different. And they would be correct.
That said, I have a good reason for mixing up stocks and flows. I do it because that’s how capitalists think. For the über rich, income and wealth are two sides of the same coin.
The ritual of capitalization
If you’re not a member of the über rich, you probably think of ‘wealth’ as a stock of stuff. For example, your neighbor Alice has a big house and a bunch of fancy cars. Alice is rich.
But what about Bob? Two doors down, Bob lives in a modest house and drives an unexceptional car. Is Bob rich? You’d probably say no. But what if you learned that Bob owns billions worth of Microsoft stock? That obviously makes Bob über wealthy. But compared to Alice, the ‘stuff’ of his wealth is far less clear.
Bob, however, is not bothered by this paradox. In fact, he doesn’t even think about the ‘stuff’ he owns. Instead, he looks at his income. Or rather, he looks at Microsoft’s income and then pegs his wealth accordingly. In other words, Bob thinks like a capitalist.
Looking at capitalists like Bob, political economists Jonathan Nitzan and Shimshon Bichler realize that they are performing a ritual. To peg the value of property rights, investors observe the income stream secured by these rights. Then they take this income stream and divide by a discount rate of their choosing. The result is capitalized value:
Now the catch here is that the capitalization ritual is based on two quantities that are undetermined. Future earnings are, by definition, unknown. And the choice of discount rate is a matter of taste. So we’re left where we started — with a capitalized value that is undefined.
Not to worry. Capitalists solve the problem with customs. They agree to judge future income by looking at recent quarterly earnings. And they choose a discount rate by looking at what everyone else is doing. As a result of this herd behavior, ‘income’ and ‘wealth’ become (statistically) interchangeable.
Figure 3 illustrates the pattern using data from publicly traded US companies, observed over the last 50 years. On the horizontal axis, I’ve plotted each company’s income stream — its quarterly profit, measured relative to the annual average. On the vertical axis, I’ve plotted each company’s capitalized value (again, measured relative to the annual average). When we step back and look at the entire herd of companies, we find a remarkably consistent behavior: more income leads to greater capitalization.
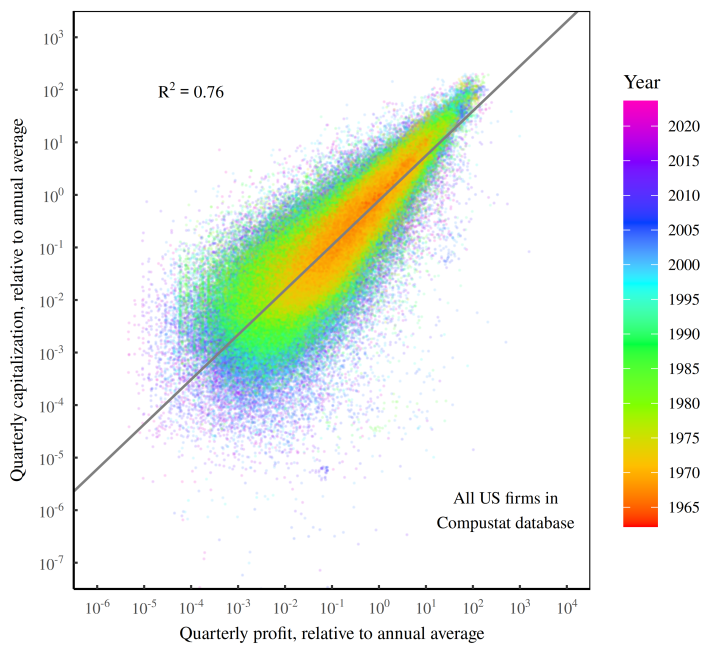
Now that we understand the ritual of capitalization, let’s return to our billionaires. In Figure 2, we found that the billionaire headcount tends to increase with a country’s per capita income. We now know the reason for this pattern. It arises because income is what gets capitalized into wealth.
Let’s unpack the details. When statistical agencies measure GDP, they capture (among other things) the annual profits of all the companies that reside in the given country. Investors, in turn, take these profits and capitalize them into market value. Finally, Forbes looks at this market value to judge the net worth of the billionaires on its list. The result is a closed loop between aggregate income and billionaire wealth. So as average income grows, countries accumulate more billionaires.
Billionaire excess
In my mind, the most interesting feature in Figure 2 isn’t the GDP-billionaire trend. (A moment’s thought will tell you that the number of billionaires ought to scale with average income.) No, what’s intriguing here is the deviation from the trend.
Relative to their per capita income, some countries have an excess of billionaires, and other countries have a dearth. Why? We’ll get to that in a moment. But first, let’s clarify what we’re talking about when we say ‘excess’ and ‘dearth’ of billionaires.
In technical terms, I’m referring to a ‘regression residual’. Of course, if you’re a not an expert in stats, me throwing around technical terms doesn’t help much. So let’s visualize what I’m talking about. When I say ‘deviation from the trend’ (or ‘regression residual’), I’m referring to the pattern in Figure 4.
Here, the blue points show the cross-country relation between income per capita and the billionaire headcount. The black line indicates the average trend. What interests us is the deviation from this trend, as illustrated by the two red points and their associated red lines.
These red points show the billionaire headcount in Georgia and Qatar. As you can see, both countries have roughly the same number of billionaires per capita. But when we add the context of average income, we find that Georgia and Qatar are not on billionaire par. Relative to its income, Georgia has an excess of billionaires. And Qatar has a dearth.
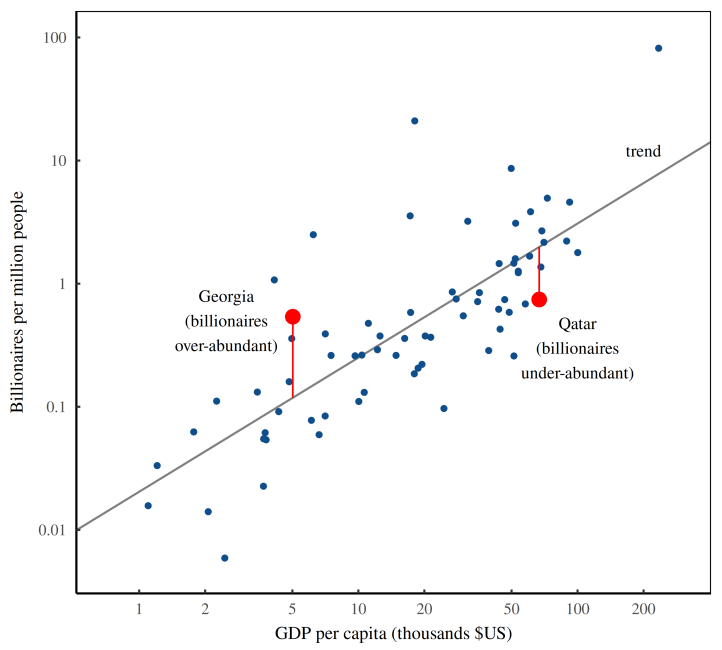
Using this thinking, we can define what I call the ‘billionaire abundance ratio’ — the ratio between a country’s actual billionaire headcount (per capita) and the billionaire headcount we expect based on the country’s average income.
Throwing our billionaire data into this equation, we get the pattern shown in Figure 5 — the billionaire abundance ratio for every country with a Forbes billionaire.

The billionaire canary
Looking at the billionaire abundance ratio, my guess is that it’s a canary for deeper social structure. Think of it this way: despots need despotism.
For example, it would be weird to find a group of fiercely egalitarian people who, despite their beliefs, all bowed to a despotic king. No, when you see a despot, you’d expect to find a despotic society. Below the king should be a class of opulent aristocrats. And below the ’crats, you’d expect a well-healed upper class. And so on, down the despot line.
The reason we expect this pattern comes down to ideology. If a society believes in egalitarianism, it makes little sense for it to embrace a despot. But if a society celebrates hierarchy, then you’d expect to find a despot, followed by a whole spectrum of less powerful players.
Now in capitalism, we no longer have feudal despots. But there’s still plenty of hierarchy. (In fact, there’s more hierarchy.) And guess who sits at the top of this hierarchy. That would be business despots … otherwise known as billionaires. So in capitalism, the same despot = despotism thinking holds. If a society has an excess of billionaires, it’s probably quite unequal. And if a society has a dearth of billionaires, you’d expect it to be more egalitarian. In short, the relative abundance of billionaires should be a canary for social inequality.
The laws of power
Social inequality. What does that mean and how do we measure it?
This question is a huge can of worms. I’ll only open it a crack.
In a modern context, most people assume that ‘inequality’ refers to the distribution of money, either in the form of income or wealth. Taking this assumption for granted, we’re left with the task of collapsing a distribution of income/wealth into a single number. There’s no ‘best’ way to do it, nor can there be.
The task of measuring inequality is similar to taking a detailed map of a landscape’s topography, and reducing it to a single value. How you do the reducing depends on what you want to achieve.
In the case of social inequality, there’s a variety of measures, ranging from well-known metrics like the Gini index to obscure metrics like the Theil index. At the bottom of the obscurity list is something called the ‘power-law exponent’, which is what I’ll use here.
Now in technical terms, a power-law exponent doesn’t capture ‘inequality’ so much as it quantifies the behavior of a distribution tail. At this point, I’m throwing around a lot of jargon, so let’s move down to earth by asking the following question: how many people have double your wealth?
The question sounds difficult to answer, but is actually quite simple … provided that you are wealthy. If you’re a member of the elite, we can predict how many people have double your net worth using a single parameter which we’ll call �.
For example, if �=3, then people with double your wealth are 23=8 times rarer than you. And if �=2, then people with double your wealth are 22=4 times rarer than you. And so on. Given �, people with double your wealth are 2� times rarer than you.
Now it sounds crazy that we can answer a question about social inequality using grade-school math. And in a sense, it is crazy. But it’s craziness of the empirical kind. You see, it’s an empirical fact that among the elite, the distribution of wealth tends to follow a power law. And the properties of this power law can be summarized using a parameter called � — the exponent in the following equation:
Here, �(�) describes the probability of finding someone with net worth �. We call this relation a ‘power law’ because of its mathematical form — � raised to some power �.
What’s odd about power laws is that they use grade-school math to describe complex, real-world outcomes. Setting aside why these patterns exist (another can of worms), let’s study an example. As it happens, when we look at the distribution of wealth in the United States, we find a textbook example of a power law. Figure 6 illustrates.
Here, the blue curve shows the distribution of US wealth in 2019 (the most recent year with available data). The horizontal axis indicates individual net worth, measured relative to the median and plotted on a logarithmic scale. The vertical axis indicates the relative abundance of people, also plotted on a log scale.
What interests us most in Figure 6 is the red line. Among US elites, we can accurately model the distribution of wealth with a straight line. Importantly, the line is ‘straight’ in the context of our double log scales. If we do the math, that means we’ve found a power law.4
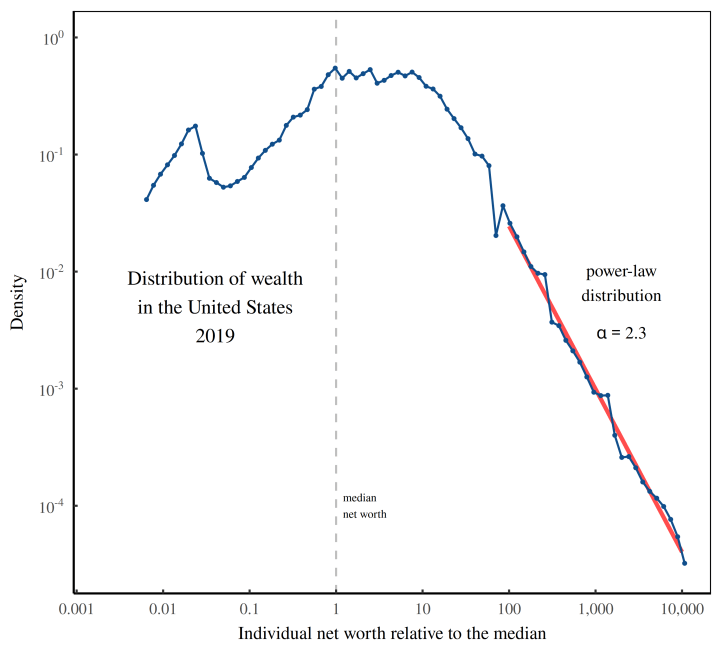
In the case of the US circa 2019, the power law has an exponent of �=2.3. So if you’re an American elite, someone with double your net worth is about 22.3≈4.9 times rarer than you.
Simple examples aside, what the power-law exponent does is capture the shape of the wealth-distribution tail. A higher exponent indicates a thinner tail. And a lower exponent indicates a fatter tail.
Because it isolates the distribution tail, the power-law exponent gives a unique window into the lives of the über rich. In short, if billionaires are canaries for inequality, their presence should relate to the power-law distribution of wealth.
(Not) predicting billionaire over-abundance with the power-law exponent of wealth
And now I eat my words. Having boldly proclaimed that billionaires are canaries in the inequality coal mine, let’s look at data which says they’re not.
Figure 7 tells the story.
Backing up a bit, recall that we previously calculated the ‘billionaire abundance ratio’ — a country’s billionaire headcount divided by its expected headcount (as predicted by its GDP per capita). Our goal now is to see if wealth inequality, measured using the power-law exponent, can predict this abundance ratio. Looking at Figure 7, the answer is a resounding no. When we plot the billionaire abundance ratio against the power-law exponent of wealth, we get a textbook example of statistical mud.
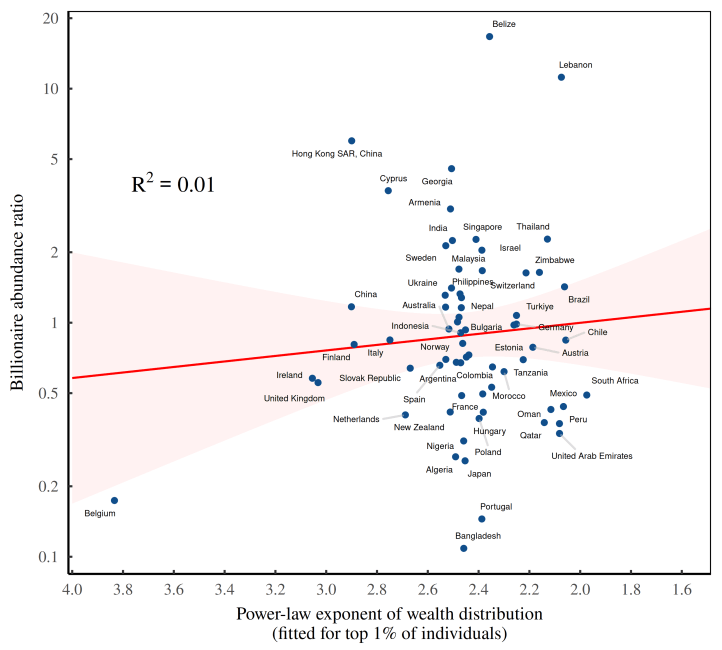
According to Figure 7, the presence of billionaires is almost entirely unrelated to a country’s distribution of wealth. And that strikes me as odd.
You see, there’s a century’s worth of evidence telling us that wealth distributions tend to have a power-law tail. And since billionaires are part of this tail, we ought to be able to predict their relative numbers by looking at the power-law exponent. Yet we cannot. Why?
As you’ll find out, part of the problem is my method. (Power laws are unwieldy beasts.) But a bigger problem is the data itself. In Figure 7, I’ve used wealth data from the World Inequality Database (WID). And if you read the fine print in the WID methods, they warn you that their data is ‘imperfect and provisional’.
Fair enough. But what WID doesn’t disclose is that its wealth data is more ‘imperfect’ and more ‘provisional’ than its income data. That fact is left for the user to find out. Come, let’s have a look.
(Somewhat) predicting billionaire over-abundance with the power-law exponent of income
To understand the strengths and weaknesses of the World Inequality Database, it helps to know its history.
The database began life about a decade ago, as a site that was then called the ‘World Top Incomes Database’. Note the word income. At the time, the database was built to house the research of Thomas Piketty and his collaborators, who were revolutionizing the study of income inequality by getting their hands on juicy income-tax data.
In 2017, the site was rebranded as the ‘World Inequality Database’ — a name that reflected the growing breadth of data. Still, the core strength of the database remained the study of income. So yeah, you can download WID data for the distribution of wealth. But whether you should trust this data is an open question.
In contrast, WID income data appears more reliable. How do I know that? Because the billionaire canaries tell me so.
We can hear their chirp in Figure 8. In this chart, I’ve done the same thing as in Figure 7. But instead of fitting a power law to the distribution of wealth, I’ve fit it to the distribution of income. The results are more satisfying. Our power-law exponents explain at least some of the variation in the billionaire abundance ratio.
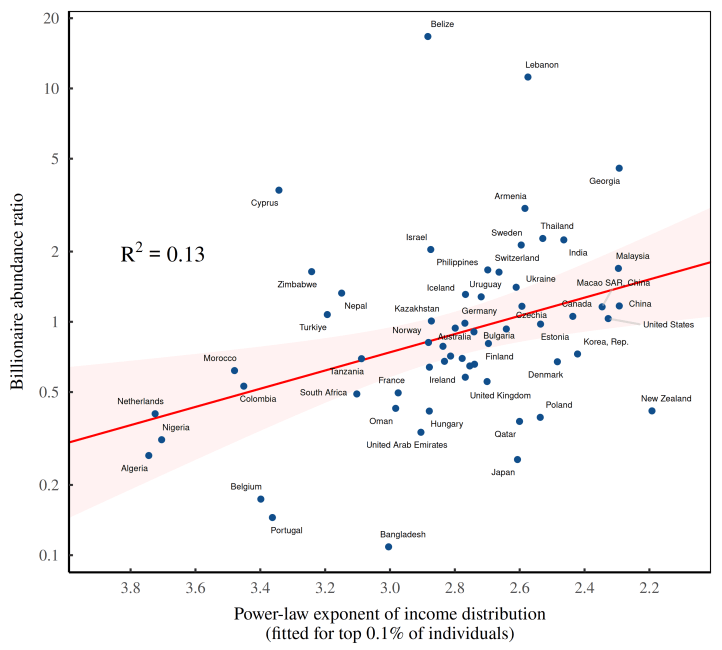
To summarize, we’ve confirmed our suspicion: the relative abundance of billionaires is a function of social inequality, as measured by the distribution of income. And that means that billionaires are indeed inequality canaries. The problem is that their chirp is frustratingly meager. Why?
The path to semi-non-confusion
The truth about doing science is that it involves a lot of confusion. For every flashy result that makes it into a paper, there are dozens of undocumented wrong turns and dead ends. What I’ve shown you so far is my path to semi-non-confusion.
First, I was confused when I discovered that wealth inequality had nothing to say about the presence of billionaires. I was less confused when I learned that this wealth data was probably flawed, and that income inequality somewhat predicts the presence of billionaires.
Now to the last step. Months into my billionaire research, I remembered that power laws are unwieldy beasts that don’t take kindly to summary statistics. In short, I realized that although you can summarize a power law using the power-law exponent, that exponent doesn’t give you a full description of the beast’s behavior. To observe this behavior, you have to actually apply the power law and let the beast run wild.
Let’s do that now.
Modeling the head of a pin
Although it took me months to realize it, there is a simple way to connect the distribution of wealth (or income) directly to the number of billionaires. I’ll get to the specifics in a moment. But first, let’s start with a metaphor.
Think of the distribution of wealth as a pin with an immaculately thin tip. Our task is to stare at the visible portion of the pin and then predict its shape as we approach the microscopic end. Here’s how we’ll do it. First, we measure how the pin’s thickness decreases as we near the tip. Then we extrapolate this trend into the microscopic region we cannot see. If all goes well, we’ve used macroscopic behavior to predict microscopic patterns.
In this metaphor, the head of the pin is the region where billionaires live. The region is ‘microscopic’ in the sense that billionaires are vanishingly rare, and their numbers are not described by macro statistics about social inequality. That said, we can try to predict the number of billionaires by looking at how the ‘pin’ — the distribution of wealth (or income) — tapers as it approaches the tip. The way we make this prediction is by fitting a power law to the macro-level data, and then extrapolating this power law into the billionaire zone.
Figure 9 illustrates the method. Here, the blue curve shows the US distribution of wealth in 2019. Notice that this curve stops short of describing the zone where billionaires live — the region to the right of the dashed purple line. Still, we can estimate the number of US billionaires using the red line, which shows the best-fit power law. If we extend this power law into the billionaire zone, it will directly predict the number of US billionaires (indicated by the purple shaded region).
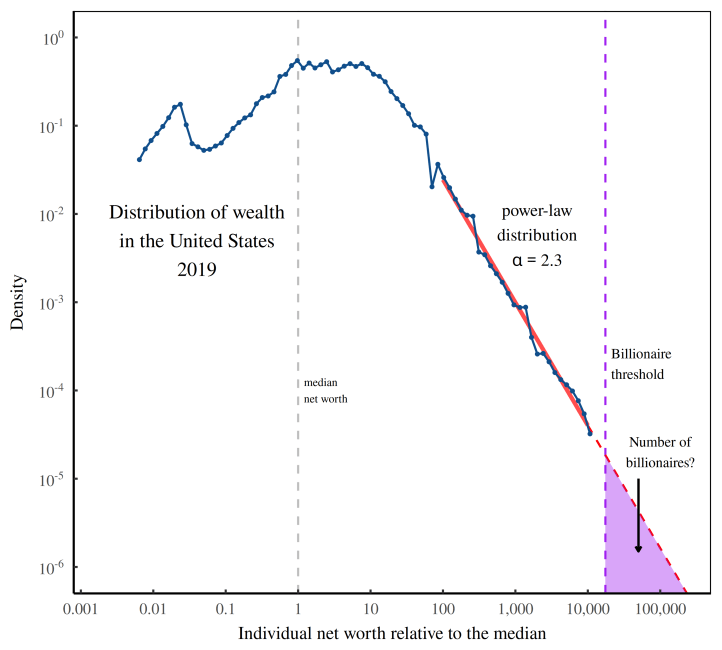
Now let’s do the math. If we carry out the extrapolation shown in Figure 9, we predict that the US had about 7 billionaires per million people. That’s not far from the Forbes billionaire count — which is around 2.2 billionaires per million people (in 2021).
Of course, the ‘not far’ has to be judged in context. Yes, we’re off by a factor three. But across countries, the billionaire headcount varies by a factor of ten thousand. (See Figure 1.) So predicting this headcount within a factor of three is actually quite good.
(Poorly) predicting the number of billionaires from the power-law distribution of wealth
Before we pat ourselves on the back, we should realize that the United States is typically an outlier, in the sense of having exceptionally good data about wealth (and income) inequality. In other words, prepare yourself for disappointment; when we apply the same billionaire-predicting approach to every country (with available data), we get results that are frustratingly murky.
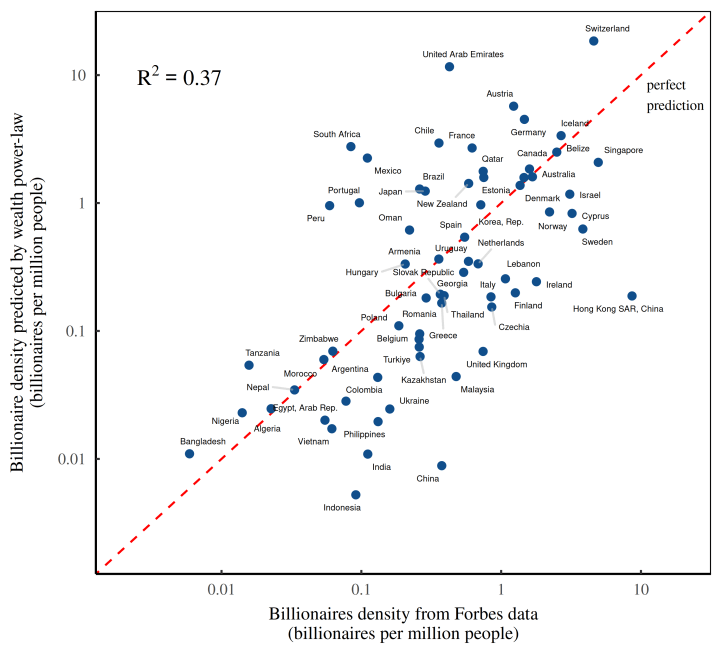
Figure 10 visualizes the muck. Here, the horizontal axis shows Forbes billionaire headcounts across countries. The vertical axis shows the billionaire headcounts we predict by fitting a power law to each country’s distribution of wealth. Based on the R2 value, we can say that our wealth-based predictions explain about 37% of the variation in billionaire headcounts.
Now in the social sciences, 37% accuracy would usually be deemed fairly good. But in our case, it’s quite bad. Here’s why.
Looking back at Figure 2, we found that a country’s average income explained about 61% of the variation in billionaire headcounts. And average income is a very coarse-grain statistic. So you’d think that by looking at the fine-grain distribution of wealth, we’d be able predict billionaire headcounts with much better accuracy. Yet when we carry out our fine-grain prediction, we get results that are much … worse.
Here’s the upside. Although they’re disappointing, our murky results still tell us something important. In this case, we’ve learned that wealth data from the World Inequality Database is particularly unreliable.5
Capitalizing income (quite accurately) predicts the number of billionaires
Fortunately, we don’t need to end on a downer. With a slight change to our method, we can turn billionaires into predictable vermin. The key is to capitalize income.
Let me explain.
We already know that in the World Inequality Database, the income data is far superior to the wealth data. The problem, though, is that income data does not directly predict the billionaire headcount, which is a feature of the distribution of wealth. But not to worry. We can get the job done by using the ritual of capitalization.
Back in Figure 3, I showed you how investors capitalize companies by looking at their earnings. To judge a company’s market value, investors take the company’s recent profits and divide by a discount rate of their choosing. The result is capitalized value.
Now typically, this ritual is applied to companies. But we can also apply it to individuals. To estimate someone’s wealth, we simply capitalize their income:
For example, suppose that someone earns $20 million a year. If we capitalize this income using a discount rate of 5%, we determine that this person is worth $1 billion. We’ve found a billionaire!
Does this method involve a lot of hand waving? Absolutely. But note that it’s the ritual that Forbes uses to peg the wealth of people like Charles Koch. You see, Koch owns a private company — the petroleum conglomerate Koch Industries. And because it is private, Koch Industries has no stock-market value, meaning Charles Koch’s wealth is unknown.
Forbes, however, is not deterred. To estimate (guess) Koch’s wealth, Forbes first capitalizes Koch Industries’ income stream using a discount rate of their choosing. (They claim to infer the discount rate from the market.) Then Forbes uses this capitalized value to estimate (guess) Koch’s net worth. Yes, this procedure is hand wavy. But what else do you expect from a capitalist ritual?
Back to our billionaire predictions. The ritual of capitalization provides a simple way to convert income into wealth. And that means we have a path for using income data to directly predict the number of billionaires.
The steps are nearly the same as before. We fit a distribution of wealth with a power law, and then use this power law to predict the number of billionaires. The difference now is that we derive our wealth data by capitalizing income. I take income data from the World Inequality Database and capitalize it using a discount rate of 5%. Presto! We have a distribution of wealth, and a prediction for the billionaire headcount.
What’s surprising is just how far this hand-waving calculation gets us. As Figure 11 shows, it renders billionaires into predictable pests. By looking at the distribution of income, we can predict the presence of billionaires with startling accuracy.6 7
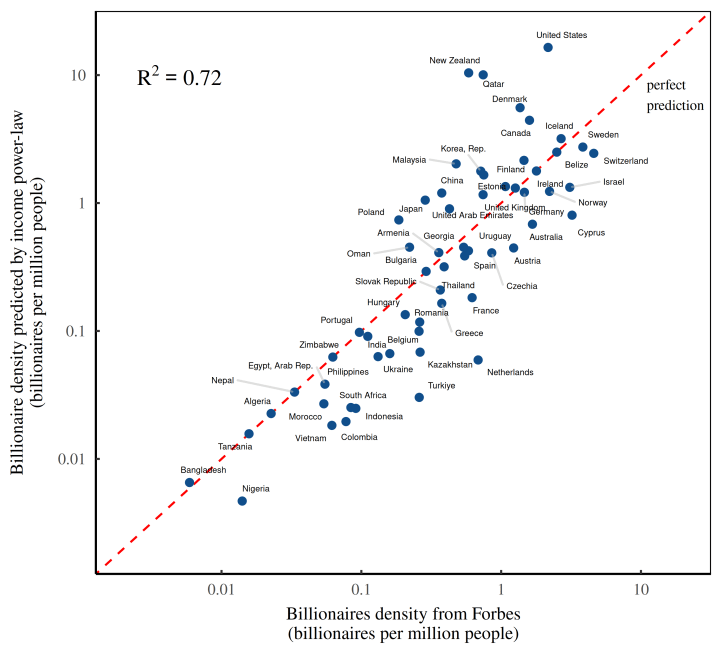
After much head-scratching and many dead ends, we’ve finally confirmed what we suspected all along. What Figure 11 shows is that billionaires are socially made.
Here’s the logic. Suppose that apologists for the über rich are right when they assert that most billionaires are ‘self made’. If this claim were true, then their ascent to outrageous wealth shouldn’t depend on the social context. No, by shear force of will, each billionaire bootstraps himself/herself into existence. So if we want to predict the presence of billionaires, we should look at their individual characteristics.
Now to the flaw in this reasoning. In Figure 11, individual characteristics are nowhere to be seen. Instead, we’ve predicted billionaire headcounts by looking at the social environment — the distribution of income. The unavoidable conclusion is that billionaires overwhelmingly owe their existence not to themselves, but to everyone else.
The socially made billionaire: How Forbes falsifies Forbes
There’s something delightfully satisfying about using Forbes data to show that billionaires are socially made. That’s because, perhaps more than any other publication, Forbes loves to swoon over the ‘self-made’ status of the über rich.
For example, in 2021, Forbes breathlessly declared that of the 400 richest Americans, about 70% of them were ‘self-made’. How did Forbes get this value? It turns out that their self-made bar is naively simple: if a billionaire didn’t inherit his/her wealth, Forbes claims that he/she is ‘self-made’.
If only things were so cut and dry. In reality, making the ‘self-made’ claim requires doing far more than demonstrating a billionaire’s lack of inherited wealth. To be ‘self-made’, you also have to show that the billionaire didn’t benefit from their social environment. And that, my friends, is a supremely high bar.
Imagine, for example, how Bill Gates might have done if he hadn’t been born in a rich country like the United States. And imagine if he hadn’t started building his empire at precisely the time that social inequality skyrocketed (in the 1980s). Would Gates still have become the world’s wealthiest person?
For this type of single-person counterfactual, all we can do is guess. But for billionaires as a group, we can do much better. In fact, we can say with reasonable certainty that few of them are self-made. Why? Because we can accurately predict the presence of billionaires using a social criteria — namely, the distribution of income.
The fun part here is that we’re using Forbes data to turn Forbes’ self-made claims on their head. According to Forbes, 70% of billionaires are ‘self-made’. But their own data shows the mirror opposite: variation in the number of billionaires is at least 70% due to the social distribution of income.8
So forget about the personal traits that billionaires love to celebrate. We don’t need them. If we want to understand why billionaires exist, look to the society they inhabit.
SUPPORT THIS BLOG
Hi folks. I’m a crowdfunded scientist who shares all of his (painstaking) research for free. If you think my work has value, consider becoming a supporter.
STAY UPDATED
Sign up to get email updates from this blog.

This work is licensed under a Creative Commons Attribution 4.0 License. You can use/share it anyway you want, provided you attribute it to me (Blair Fix) and link to Economics from the Top Down.
Sources and methods
FORBES BILLIONAIRES
I’ve been scraping the Forbes billionaire data daily since October 2021. I calculate the number of billionaires per capita using country population data from the World Bank, series SP.POP.TOTL. In Figure 2, GDP per capita data is from the World Bank, series NY.GDP.PCAP.CD.
THE RITUAL OF CAPITALIZATION
Data in Figure 3 is from Compustat, as follows:
- quarterly profit: series
niq - quarterly capitalization: the product of common shares outstanding, series
cshoq, times the quarterly closing share price, seriesprccq
To display the data on a common scale, I’ve measured profit and capitalization relative to the respective average for US firms in the Compustat database.
THE DISTRIBUTION OF INCOME AND WEALTH
Data for the distribution of income and wealth comes from the World Inequality Database, using the following series:
thwealj992: wealth thresholds by percentile (reported in local currency)shwealj992: wealth share by percentiletptincj992: income thresholds by percentile (reported in local currency)sptincj992: income share by percentile
I fit power laws to this data using the method outlined by Yogesh Virkar and Aaron Clauset in their paper ‘Power-law distributions and binned empirical data’.
For wealth data, I use a power-law cutoff that corresponds to the top 1% of individuals. For the income data (which is generally more detailed), I use a power-law cutoff that corresponds to the top 0.1% of individuals.
CONVERSION FACTORS
Forbes reports wealth in US dollars, whereas the World Inequality Database (WID) uses local currencies. When using WID data to predict the number of billionaires, I convert the billionaire threshold into local currency. To get the conversion factor, I use World Bank data, which reports GDP in both US dollars (series NY.GDP.PCAP.CD) and in local currency (series NY.GDP.PCAP.CN).
To convert income into wealth, I ‘capitalize’ income using a discount rate of 5%.
Some power-law math
Here’s a dive into the mathematics of power laws.
Suppose the distribution of wealth follows a power law. The probability of finding someone with wealth � is given by:
Here � is the power-law exponent and ���� is the lower cutoff for our distribution. (Power laws must have a lower cutoff, otherwise they explode as you approach �=0.)
Now let’s do some statistics. Suppose we want to know the portion of individuals with wealth that is greater than (or equal) to some value �. This quantity is defined by the complementary cumulative distribution, which we get by integrating �(�) from � to infinity:
In this case, we want to know the portion of individuals who are billionaires. So we evaluate our complementary cumulative distribution, �(�), at �=109. Easy peasy.
The complication comes when we look at real world data. In this case, the power law only describes the tail of the income/wealth distribution. So �(�) describes the portion of billionaires in the distribution tail, rather than the portion of billionaires in the whole population (which is what we want).
Luckily, there’s a simple fix. That’s because I’ve used data from the World Inequality Database to define both the power-law cutoff ���� and the power-law exponent �. Importantly, the ���� data is associated with a known income/wealth percentile.
For example, suppose we define ���� so that it corresponds to the wealth cutoff for the 99th percentile. That means �(�) describes the wealth distribution for the top 1% of individuals. So if we want to know the billionaire fraction in the whole population, we take �(�) and multiply by 1%.
(The assumption here is that ����<109, meaning only people above ���� can be billionaires.)
DISCRETE PROBLEMS
Another problem with our function �(�) is that it will predict billionaire fractions that are impossible in the real world.
The issue is that �(�) assumes an infinite population, in which case the billionaire density can range anywhere from 0 to 1. But in the real world where populations are finite, not all values are possible.
For example, suppose a country with 1 million citizens has one billionaire. In this case, the billionaire density is 1 per million. Now suppose that our function �(�) predicts a billionaire density of 0.1 per million. Clearly that value is impossible. The real-world billionaire density can be either 1 per million or none per million.
Actually, it can only be the former. You see, by design, I’m analyzing only the countries that (according to Forbes) have billionaires. So in a country with population �, the minimum billionaire density is 1/�. In contrast, our analytic function �(�) will predict densities that go all the way to zero. As such, when we use this function to predict real-world billionaire density, it will have a downward bias, as shown in Figure 12.
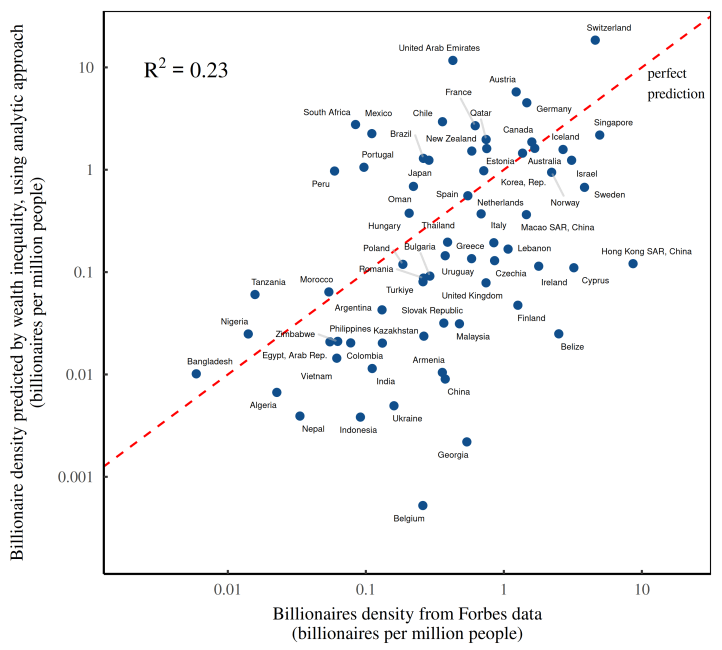
This bias highlights a general problem with power laws. Their analytic form is simple, yet their real-world behavior can be quite complex.
As a rule, I deal with this complexity problem by using numerical data. In Figures 10 and 11, I predict the billionaire density by sampling data from a continuous power-law distribution, and then counting what portion of the sample are billionaires. You can try your hand at it using the rlpcon function from the R poweRlaw package. If you’re interested, I’ve written a tutorial here.
Notes
Further reading
Fix, B. (2021a). Economic development and the death of the free market. Evolutionary and Institutional Economics Review, 1–46.
Fix, B. (2021b). The ritual of capitalization. Real-World Economics Review, (97), 78–95.
Nitzan, J., & Bichler, S. (2009). Capital as power: A study of order and creorder. New York: Routledge.
Piketty, T. (2014). Capital in the twenty-first century. Cambridge: Harvard University Press.
Virkar, Y., & Clauset, A. (2014). Power-law distributions in binned empirical data. The Annals of Applied Statistics, 8(1), 89–119.

