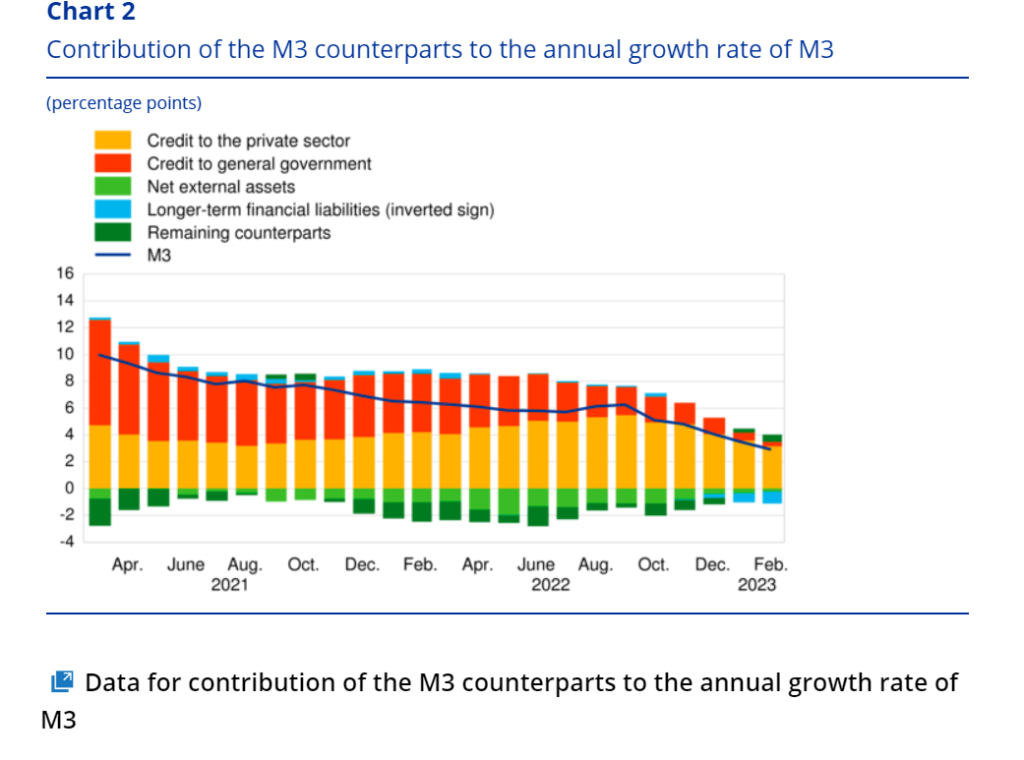
This ECB graph below, showing the interrelation between credit and money in the Euro Area (source) is thoroughly (Post-)Keynesian in nature: Modern Monetary Statistics (MMS). I’ll return to that. First, what does it tell? For some months, a gentle Euro Area ‘liquidity crunch’ has been going on. The yellow and the orange bars are getting smaller meaning that year on year growth rates of ‘M3’ money creating ‘credit’ are declining. Three month flow data are already negative. Loans are payed back, money is moved from checking accounts to savings accounts (which are not included in the M3 definition of money, the blue bar). Mind: ‘credit to general government’ does not mean: lending to governments. It means: purchasing government debt from anybody except system banks, pension funds
Topics:
Merijn T. Knibbe considers the following as important: Uncategorized
This could be interesting, too:
tom writes The Ukraine war and Europe’s deepening march of folly
Stavros Mavroudeas writes CfP of Marxist Macroeconomic Modelling workgroup – 18th WAPE Forum, Istanbul August 6-8, 2025
Lars Pålsson Syll writes The pretence-of-knowledge syndrome
Dean Baker writes Crypto and Donald Trump’s strategic baseball card reserve
This ECB graph below, showing the interrelation between credit and money in the Euro Area (source) is thoroughly (Post-)Keynesian in nature: Modern Monetary Statistics (MMS). I’ll return to that. First, what does it tell?

- For some months, a gentle Euro Area ‘liquidity crunch’ has been going on. The yellow and the orange bars are getting smaller meaning that year on year growth rates of ‘M3’ money creating ‘credit’ are declining. Three month flow data are already negative. Loans are payed back, money is moved from checking accounts to savings accounts (which are not included in the M3 definition of money, the blue bar). Mind: ‘credit to general government’ does not mean: lending to governments. It means: purchasing government debt from anybody except system banks, pension funds being especially important. Pension funds used to receive quite some money from the ECB by selling bonds to the ECB, transactions financed by new money – not anymore. .
- People and companies are (finally) moving massive amounts of money from non-interest bearing deposit accounts to longer term ‘blue bar’ saving accounts. What I do not understand is why (Dutch!) banks do not increase interest rates on longer term savings accounts to speed this up – this will at least in the short term mitigate problems caused by possible bank runs as it will disempower clients to shift money to other banks or destinations (correct me when I’m wrong).
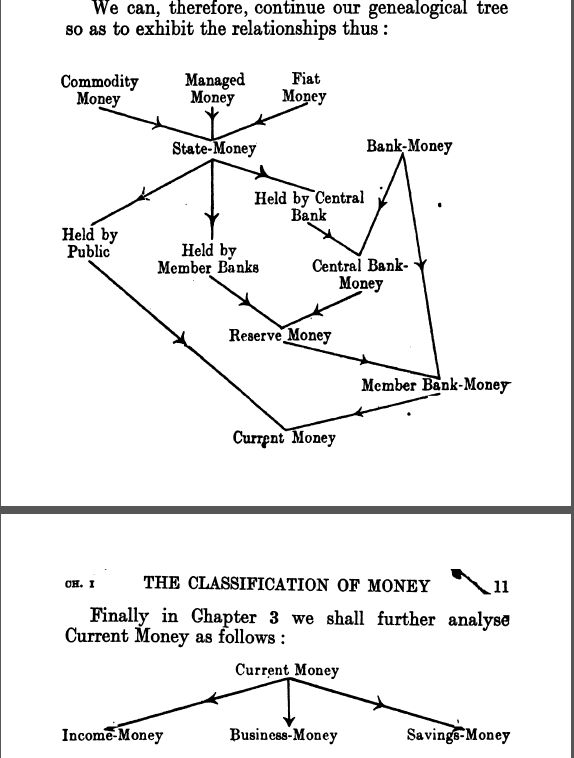
- As will be clear: understanding MMS requires institutional knowledge. Also, it good to know that the institutional units used to measure these data are fully consistent with the National Accounts and the Flow of Funds (see chapter 3 of this book). The system banks who have to provide the monthly data for the ECB monetary statistics are the same as the system banks in the National Accounts while the flows of credit shown are the same which are shown in the national accounts as part of the funding of consumption and investment. MMS (pioneered in the sixties of the 20th century and by the Bundesbank, among others, and now used by all major central banks) are also fully consistent with (Post)-Keynesian thinking. In Keynes’ ‘Treatise on money‘ (Part I p. 10) we can find this graph:

It’s not as sophisticated as the ECB graph. It lacks operationalization, data and a thorough basis in the flow of funds (which at this time still had to be developed by Morris Copeland, in cooperation with the Fed and the NBER led by Wesley Mitchell). But we do see the difference between short term and longer term deposits (savings money), we do see different money holding sectors (households and income money, banks and business money), we do see the important of reserves (‘Central Bank Money) and the difference between state money and bank money. In the Treatise, Keynes also uses it in an analytical way.
4. The reason why the ECB causes the present liquidity crunch shown in the first graph is clear. They want to bring down inflation. It can however be called into question if central banks control inflation at all – let alone if they are able to fine tune it. Weber, Jauregui, Lucas and Pires use an input-output approach to inflation, analyzing the propagation of inflationary shocks throughout the economy. It turns out that one shock (oil price increases) might lead to entirely different consequences than another shock (food price increases) meaning that different kinds of inflation might need different solutions. Input output analysis was, by the way, pioneered by Simon Kuznets (another protégé of Wesley Mitchell, Mitchell himself being a proud student of Veblen) and is based upon the same classifications as the national accounts mentioned above. Interest rate policies are, in the end, based on a ‘holistic’ concept of a ‘one good’ economy instead of upon an economy consisting of interrelated sectors. Let me be clear: interest increases were, as interest rates were very low, needed to put a break on runaway asset price increases (houses…). Just like Josh Mason and Varoufakis I’m not necessarily a fan of negative rates. But especially in a high debt environment, higher rates have a price: purchasing power directly decreases. Increasing rates fast and furious just to show off and to appear ‘credible’ (the buzz word of neoclassical monetary analysis) is not the kind of ‘credible’ central bank policy we need. We need multiple instruments to keep asset prices and product prices and factor prices (profits and wages): checks and balances with an eye on debts and incomes. And alas (at least for neoclassical economists) this means that governments can’t outsource inflation policies to central banks. Let’s follow Veblen, Mitchell, Kuznets, Keynes, Copeland and Weber e.a. (and the ECB statisticians) who showed and show us the way how to do this.
