Share the post "Assessing the Utility of Wall Street’s Annual Forecasts" It’s that time of year when everyone starts preparing for the New Year and Wall Street makes its 2016 predictions. I’ll get right to the point here – these annual predictions are largely useless. But it’s still helpful to put these predictions in perspective because it highlights a good deal of behavioral bias and some of the mistakes investors make when analyzing their portfolios. The 2016 annual stock market predictions are reliably bullish. Of the analysts that Barrons surveyed they found no bears and an expected average return of 10%. This is pretty much what we should expect. After all, predicting a negative return is a fool’s errand given that the S&P 500 is positive about 80% of the time on an annual basis. And the S&P 500 has averaged about a 12.74% return in the post-war era. So, that 10% expected return isn’t far off from what a smart analyst might guess if they’re at all familiar with probabilities. There is a chorus of boos (and some cheers) every year when this is done. No analyst will get the exact figure right and there will tend to be many pundits who ridicule these predictions despite the fact that expecting a positive return of about 10% is the smart probabilistic prediction.
Topics:
Cullen Roche considers the following as important: Investing Basics, Investment Strategy, Most Recent Stories
This could be interesting, too:
Cullen Roche writes Understanding the Modern Monetary System – Updated!
Cullen Roche writes We’re Moving!
Cullen Roche writes Has Housing Bottomed?
Cullen Roche writes The Economics of a United States Divorce
It’s that time of year when everyone starts preparing for the New Year and Wall Street makes its 2016 predictions. I’ll get right to the point here – these annual predictions are largely useless. But it’s still helpful to put these predictions in perspective because it highlights a good deal of behavioral bias and some of the mistakes investors make when analyzing their portfolios.
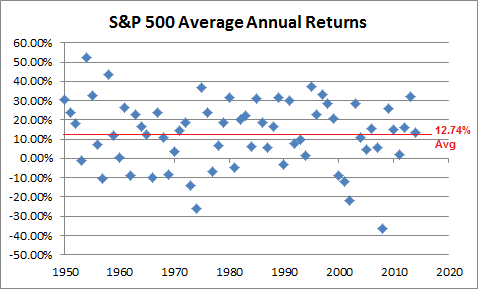
The 2016 annual stock market predictions are reliably bullish. Of the analysts that Barrons surveyed they found no bears and an expected average return of 10%. This is pretty much what we should expect. After all, predicting a negative return is a fool’s errand given that the S&P 500 is positive about 80% of the time on an annual basis. And the S&P 500 has averaged about a 12.74% return in the post-war era. So, that 10% expected return isn’t far off from what a smart analyst might guess if they’re at all familiar with probabilities.
There is a chorus of boos (and some cheers) every year when this is done. No analyst will get the exact figure right and there will tend to be many pundits who ridicule these predictions despite the fact that expecting a positive return of about 10% is the smart probabilistic prediction. In fact, if most investors actually listened to these analysts and their permabullish views they’d have been far better off buying and holding stocks based on these predictions than most investors who constantly flip their portfolios in and out of stocks and bonds. But that’s the reason why these predictions exist in the first place. Because every year investors perform their annual check-ups and evaluate the last 12 months of performance before deciding to make changes. And of course, Wall Street encourages you to do exactly that because turning over your portfolio means increasing the fees paid to the people who promote these annual predictions. But when we put this analysis in the right perspective it becomes clear that this mentality is misleading at best and highly destructive at worst.
Stocks and bonds are relatively long-term instruments. The average lifespan of a public company in the USA is about 15 years.¹ And the average effective maturity of the aggregate bond index is about 8 years.² This means that an investor who holds a portfolio of balanced stocks and bonds holds instruments with a lifespan of about 11.5 years. When viewed through this lens it becomes clear that evaluating a portfolio of long-term instruments on a 12 month basis makes very little sense. What we do on an annual basis with these portfolios is a lot like owning a 12 month CD that pays a one time 1% coupon at maturity and getting mad that the CD hasn’t generated a return every month. But this annual perspective makes even less sense from a probabilistic perspective.
As I’ve described previously, great investors think in terms of probabilities. When we look at the returns of the S&P 500 we know that returns tend to become more predictable as we extend time frames. And the probability of being able to predict the market’s returns increases as you increase the duration of the holding period. While the probability of positive returns becomes increasingly skewed as you extend the time frame there is still far too much randomness inside of a 1 year return for us to place any faith in these predictions. The number of negative data points is only a bit lower than the number of positive data points even though the average return is positively skewed:
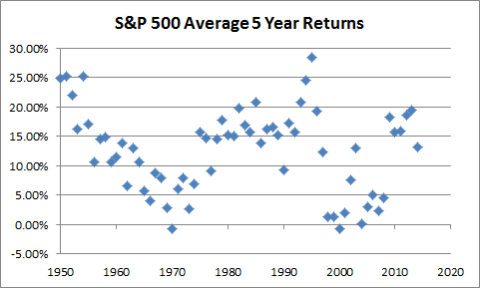
So, at what point do returns become reliably positive? If we look at the historical data we don’t have reliably positive returns from the stock market until we look about 5 years into the future when the average 5 year returns become positively skewed. A 50/50 stock/bond portfolio has a purely positive skew with an average rolling return of 3 years. Interestingly, this stock market data is just as random even though it’s positively skewed. So, trying to pinpoint what the 5 year average returns will be is probably a fool’s errand (even though stocks will be reliably positive on average over a 5 year period).
All of this provides us with some good insights into the relevancy of making forecasts about future returns. When it comes to stocks and bonds we really shouldn’t bother listening to or analyzing predictions made inside of a 12 month period. The data is simply too random. As we extend our time horizons the data becomes increasingly reliable with a positive skew. But it still remains a very imprecise science.
The bottom line – if you’re going to hold stocks and bonds it’s almost certainly best to plan on having at least a 3-5 year+ time horizon. Any analysis and prediction inside of this time horizon is likely to resemble gambling. As Blaise Pascal once said, “all of human unhappiness comes from a single thing: not knowing how to remain at rest in a room”. The urge to be excessively “active” in the financial markets is strong, however, the investor who can take a reasonable temporal perspective will very likely increase their odds of making smarter decisions leading to higher odds of a happy ending.
Sources:
¹ – Can a company live forever?
² – Vanguard Total Bond Market ETF, Morningstar


