Coronavirus dashboard for April 20: a few positive development Here is the update through yesterday (April 19) As usual, significant developments are in italics. Yesterday saw the biggest number of daily tests, and ratio of total vs. positive tests so far, both positive developments. The number and rate of daily infections and deaths also declined, but that may be a function of lower weekend reporting. Here are yesterday’s numbers. Number and rate of increase of Reported Infections (from Johns Hopkins via arcgis.com) Number: up +24,499 to 759,786 (vs. 35,354 prior peak on April 17) ***Rate of increase: day/day: 3% (vs. 4% for the past week, and 4% on April 18) The number of new infections made a new peak last Friday. The numbers seem to go
Topics:
NewDealdemocrat considers the following as important: Healthcare
This could be interesting, too:
Bill Haskell writes Families Struggle Paying for Child Care While Working
Joel Eissenberg writes RFK Jr. blames the victims
Joel Eissenberg writes The branding of Medicaid
Bill Haskell writes Why Healthcare Costs So Much . . .
Coronavirus dashboard for April 20: a few positive development
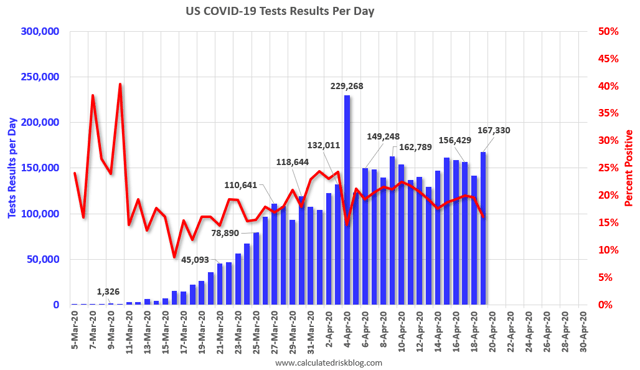
As usual, significant developments are in italics. Yesterday saw the biggest number of daily tests, and ratio of total vs. positive tests so far, both positive developments. The number and rate of daily infections and deaths also declined, but that may be a function of lower weekend reporting.
Here are yesterday’s numbers.
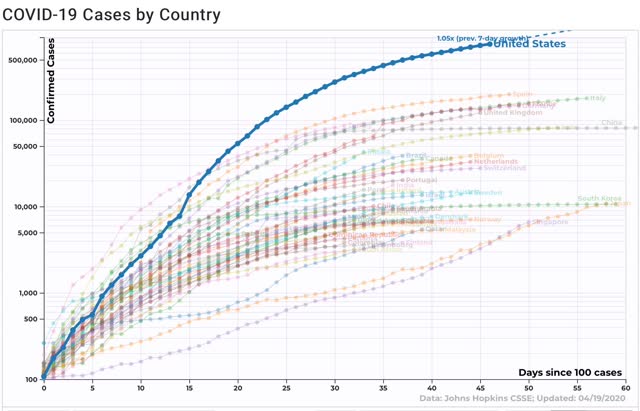
Number and rate of increase of Reported Infections (from Johns Hopkins via arcgis.com)
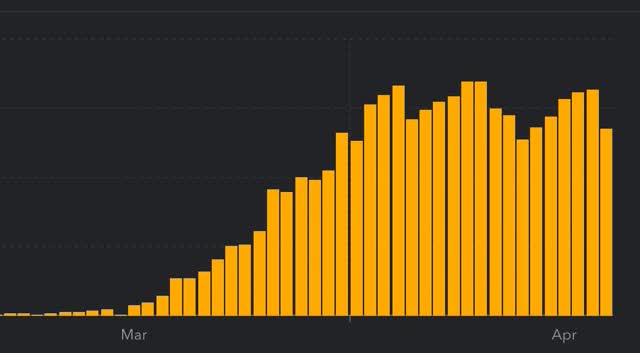
- Number: up +24,499 to 759,786 (vs. 35,354 prior peak on April 17)

- ***Rate of increase: day/day: 3% (vs. 4% for the past week, and 4% on April 18)

The number of new infections made a new peak last Friday. The numbers seem to go down on weekends, so take the low new infection number with a grain of salt. Still, the trend seems to be a slight decrease in the number of new cases.
Number of deaths and infections and rate of increase of testing (from COVID Tracking Project)
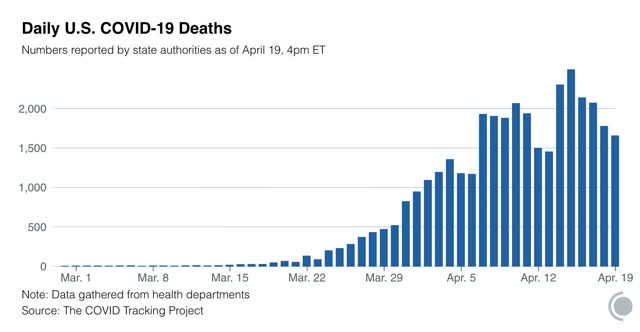
- ***Number of deaths: Total 35,793, increase of +1,654 day/day (vs. 2,492 daily high on April 15)

- Rate: increase of 5% day/day vs. average of 7% in past week
- Number of tests: 167,330, up +25,289 day/day (new daily peak)
- Ratio of positive tests to total: 6.2:1 (new daily peak)

Below are the States that have not gone to lockdown orders:
- Partial restrictions on business (bars, restaurants): 5 States (IA*, ND^, NE, UT*^, WY^) 9.7 million, 2.9%
- School closure only: 2 States (AR^, SD*) 3.9 million, 1.2%
*some local areas under lockdowns
*restrictions on or quarantine of travelers from out of State
US States and population with “test, trace, and quarantine” programs
- East Coast consortium: 7 States: CT, DE, MA, MD, NJ, NY, PA, RI (53.7 million)
- West Coast consortium: 3 States: CA, OR, WA (31.3 million)
- Midwest consortium: 7 States: IL, IN, KY, MI, MN, OH, WI (57.0 million)
- Mid-Atlantic consortium*: 3 Jurisdictions: DC, MD, VA (15.2 million)
*informal cooperation
Total population covered by consortiums: 157.2 million
Summary for April 19
- About 95% of the total US population remains under total lockdown.
- In States with no lockdowns, Trumpist governors in Wyoming and North Dakota have spoken of easing restrictions further by May 1. In Florida, a few beaches were opened up and became crowded.
- The trend in the number of daily new infections appears to be one of slight decline. Deaths appear to be plateauing. I am looking for a decline of roughly 15%/week in new infections if the peak has indeed been reached, so long as the lockdowns stay in place.
- The number of daily tests has improved a little bit to about 160,000, and we just got a new daily high. We likely are continuing to miss a large percent of new infections. My personal suspicion is that the actual number of total infections in the US is about 5x the official number, or roughly 3.8 million at present.
- The Trump Administration has taken no steps – and realistically will never take steps -towards a nationwide “test, trace, and quarantine” plan that will be needed to lift lockdowns, or to assist States to do so, and is using a haphazard, secret, and likely corrupt method of distributing vital medical equipment.
- In the absence of federal action, 20 States with almost half the US population are either coordinating in making purchases of the necessary equipment, and/or to develop their own “test, trace, and quarantine” plan, but specifics in how to accomplish that have not emerged.
- Trump finally invoked the Defense Production Act to get a company to mass produce testing swabs, which have been a key bottleneck in increasing the number of tests, after a conference call with governors.
- There have been small but very well publicized astroturf protests against lockdowns in States with Democratic or non-Trumpist Republican governors.
