Jobless claims blow away the Delta wave (but beware Labor Day seasonality) This morning’s initial jobless claims report makes it shockingly evident that the Delta wave has had no appreciable effect on at least the “firing” side of the jobs market (vs. the “hiring” side, where it might have). Initial claims declined 35,000 to 310,000, and the 4-week average also declined 16,750 to 339,500, both yet more pandemic lows: By way of reference, it took almost 5 years into the last expansion – until spring 2014 – for initial claims to be this low.Continuing claims declined 22,000 to 2,783,000, also another pandemic low: In the last expansion, this number was first seen in early 2014 as well.These are, to put it bluntly, normal
Topics:
NewDealdemocrat considers the following as important: jobless caims, US EConomics, US/Global Economics
This could be interesting, too:
NewDealdemocrat writes JOLTS revisions from Yesterday’s Report
Bill Haskell writes The North American Automobile Industry Waits for Trump and the Gov. to Act
Bill Haskell writes Families Struggle Paying for Child Care While Working
Joel Eissenberg writes Time for Senate Dems to stand up against Trump/Musk
Jobless claims blow away the Delta wave (but beware Labor Day seasonality)
This morning’s initial jobless claims report makes it shockingly evident that the Delta wave has had no appreciable effect on at least the “firing” side of the jobs market (vs. the “hiring” side, where it might have).
Initial claims declined 35,000 to 310,000, and the 4-week average also declined 16,750 to 339,500, both yet more pandemic lows:
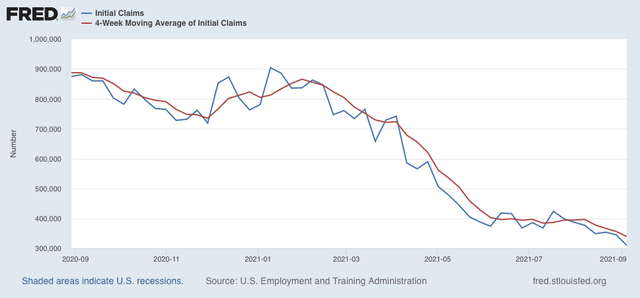
By way of reference, it took almost 5 years into the last expansion – until spring 2014 – for initial claims to be this low.
Continuing claims declined 22,000 to 2,783,000, also another pandemic low:
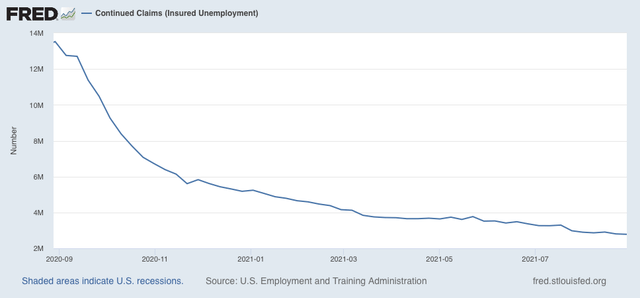
In the last expansion, this number was first seen in early 2014 as well.
These are, to put it bluntly, normal expansion numbers.
With one caveat: Labor Day seasonality may have driven some of the decline. The below graph shows the % by which the seasonally adjusted number has exceeded or fallen short of the unadjusted number, beginning in July 2020:
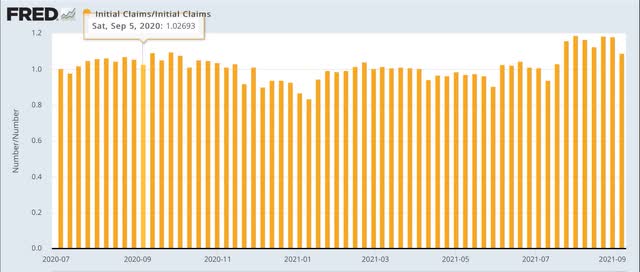
During the period from late July through October, seasonality adjusts the raw number higher. But as you can see from the call-out, the Labor Day week gets the least upward adjustment. That pattern was only accentuated this year. So take this week’s report with a grain of salt, and see if the big reduction is maintained or reversed next week.