Production, layoffs, housing hit the positive trifecta in November, New Deal democrat We got a blizzard of November and December data this morning across all three – coincident, short leading, and long leading – timeframes: industrial production, jobless claims, and housing permits and starts. All three were positive. Let’s start with the King of Coincident Indicators, industrial production, which rose 0.5% in November. Manufacturing production rose 0.7%. They are 2.3% and 0.6% above where they were before the pandemic: Both also are at 2.5 year highs, although below their peak levels during the last expansion. At this point the *only* important metric which has not exceeded its pre-pandemic level is employment, which as I explained last
Topics:
NewDealdemocrat considers the following as important: housing, layoffs, production, US EConomics, US/Global Economics
This could be interesting, too:
NewDealdemocrat writes JOLTS revisions from Yesterday’s Report
Bill Haskell writes The North American Automobile Industry Waits for Trump and the Gov. to Act
Bill Haskell writes Families Struggle Paying for Child Care While Working
Joel Eissenberg writes Time for Senate Dems to stand up against Trump/Musk
Production, layoffs, housing hit the positive trifecta in November, New Deal democrat
We got a blizzard of November and December data this morning across all three – coincident, short leading, and long leading – timeframes: industrial production, jobless claims, and housing permits and starts. All three were positive.
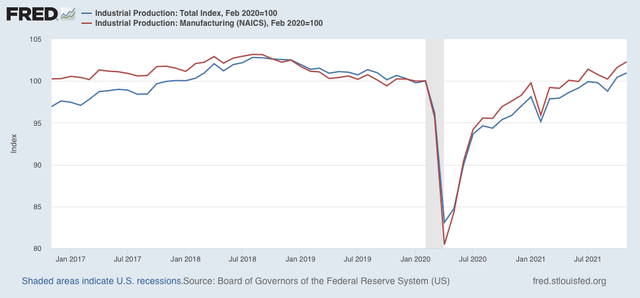
Let’s start with the King of Coincident Indicators, industrial production, which rose 0.5% in November. Manufacturing production rose 0.7%. They are 2.3% and 0.6% above where they were before the pandemic:

Both also are at 2.5 year highs, although below their peak levels during the last expansion. At this point the *only* important metric which has not exceeded its pre-pandemic level is employment, which as I explained last week, has a persistent 4,000,000 shortfall compared with job openings, which will only be closed once the pandemic is past (or at least mainly past).
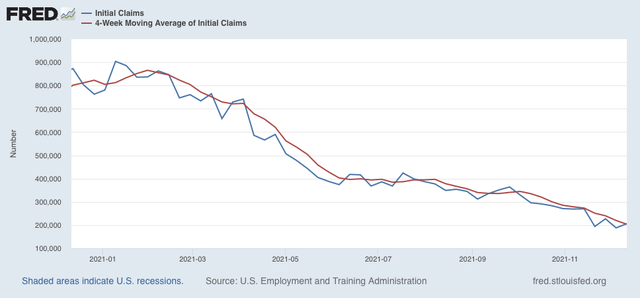
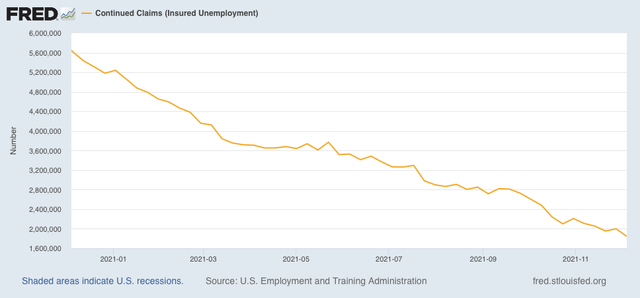
Let’s turn now to the short leading indicator of initial and continuing jobless claims, which continue at or near their best levels in the past half-century.
Initial claims rose 18,000 to 206,000 from last week’s 50 year low, while the 4 week average declined 16,000 to 203,750, which is not just a new pandemic low, but a new 50 year low:

Once again, virtually nobody is getting laid off.
Continuing claims also declined 154,000 to 1,845,000 to another pandemic low, which in the past 45 years was only bettered during the 2 year period from March 2018 through March 2020:

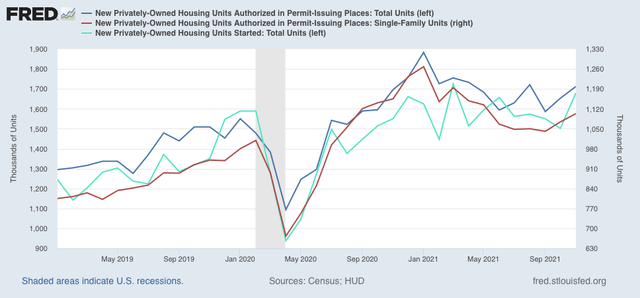
Finally, let’s look at the long leading indicator of housing permits and starts, which also improved across the board in November. Total permits increased 3.6% from October, and the less volatile single family permits increased 2.7%. Housing starts increased 11.8%:

Total permits are in the upper part of their range for the past year, while both the less volatile single family permits and the 3 month average of the more volatile housing starts are solidly off their bottoms. This has been expected, since mortgage rates moderated over the summer, and permits and starts follow typically with a 3 to 6 month lag.
In summary, the economy right now continues to hit on all cylinders except for a shortfall in employment. Over the next few months the outlook continues very positive, and looking out a full year the evidence continues to be on net, on the plus side as well.
