Real retail sales declined in November, but continue to auger well for strong jobs growth, New Deal Democrat Retail sales, one of my favorite “real” economic indicators, were reported this morning for November. They increased 0.3% for the month, and October’s blockbuster report was revised 0.1% higher, to +1.8%. After inflation, though, “real” retail sales declined -0.5%. Although real retail sales are down -2.6% from their April peak, they are +12.9% higher than they were just before the pandemic hit, and are also 4.4% higher than January of this year: They are also up 10.6% YoY. How extreme is that? The below graph subtracts 10.6% YoY growth from retail sales from 1948 through 2019: In the past 70+ years before the
Topics:
NewDealdemocrat considers the following as important: COVID-19, jobs, Retail sales, US EConomics
This could be interesting, too:
NewDealdemocrat writes JOLTS revisions from Yesterday’s Report
Bill Haskell writes The North American Automobile Industry Waits for Trump and the Gov. to Act
Bill Haskell writes Families Struggle Paying for Child Care While Working
Joel Eissenberg writes Time for Senate Dems to stand up against Trump/Musk
Real retail sales declined in November, but continue to auger well for strong jobs growth, New Deal Democrat
Retail sales, one of my favorite “real” economic indicators, were reported this morning for November. They increased 0.3% for the month, and October’s blockbuster report was revised 0.1% higher, to +1.8%. After inflation, though, “real” retail sales declined -0.5%.
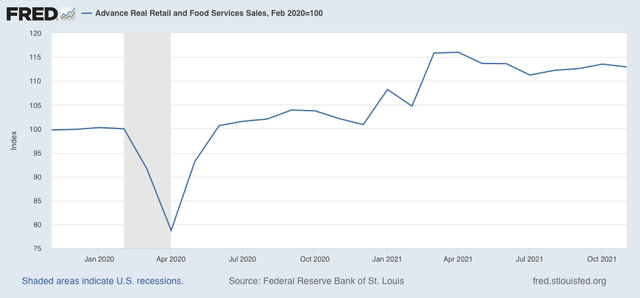
Although real retail sales are down -2.6% from their April peak, they are +12.9% higher than they were just before the pandemic hit, and are also 4.4% higher than January of this year:

They are also up 10.6% YoY.
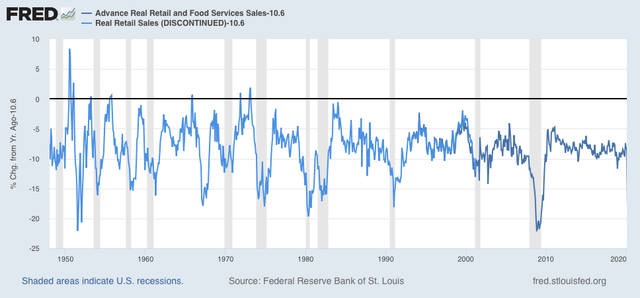
How extreme is that? The below graph subtracts 10.6% YoY growth from retail sales from 1948 through 2019:

In the past 70+ years before the pandemic, real retail sales have only been higher for about 16 months, all in the 1940s, 50s, and 60s – over half a century ago. Which, not coincidentally, is the last time the US had a very worker-strong economy. As I pointed out last month, this kind of explosive sales growth is a very important – perhaps *the* most important – driver of the transportation bottleneck, since our “just-in-time” global networks cannot handle such a sudden increase.
Now let’s turn to employment, because real retail sales are also a good short leading indicator for jobs.
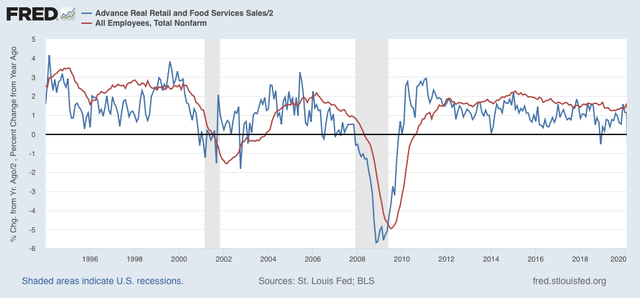
As I have written many times over the past 10+ years, real retail sales YoY/2 has a good record of leading jobs YoY with a lead time of about 3 to 6 months. That’s because demand for goods and services leads for the need to hire employees to fill that demand. The exceptions have been right after the 2001 and 2008 recessions, when it took jobs longer to catch up, as shown in the graph below, which takes us up to February 2020:

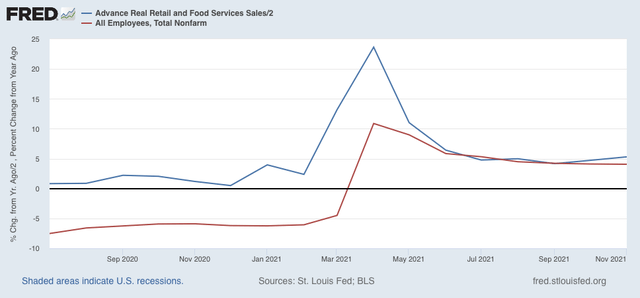
Now here is the same graph since July 2020:

Several months ago, despite two lackluster initial jobs reports, I wrote that this “argues that we can expect jobs reports in the next few months to average out about even with those from one year ago, which averaged about 500,000 per month.”
Those months were revised well higher, which means that job growth indeed has continued to average about 500,000 per month. I fully expect the “relatively” poor November jobs report to be revised higher, and that the next few months’ jobs reports should continue to average about 500,000 as well.
