An update on the yield curve This is an update on my yield curve post from earlier this week.As had happened in the previous few days, the 3 to 5 year Treasury yield spread, which was inverted intraday, un-inverted by the close of the trading day. Here is what the US Treasury yield curve looked like yesterday: As you can see, it is kinked at the 7 and 20 year maturities. Aside from that, from Fed funds out through 30 years it has a more normal shape. As I pointed out earlier, the 10 and 30 year maturities are typically where investors go to hide in a “flight to safety,” so that they have lower yields than some earlier maturities in those circumstances is not the classic yield curve inversion that has historically forecast trouble. That
Topics:
NewDealdemocrat considers the following as important: inverted yield curve, US EConomics
This could be interesting, too:
NewDealdemocrat writes JOLTS revisions from Yesterday’s Report
Bill Haskell writes The North American Automobile Industry Waits for Trump and the Gov. to Act
Bill Haskell writes Families Struggle Paying for Child Care While Working
Joel Eissenberg writes Time for Senate Dems to stand up against Trump/Musk
An update on the yield curve
This is an update on my yield curve post from earlier this week.
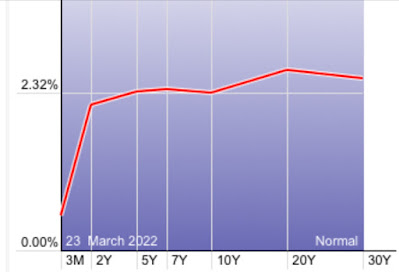
As had happened in the previous few days, the 3 to 5 year Treasury yield spread, which was inverted intraday, un-inverted by the close of the trading day. Here is what the US Treasury yield curve looked like yesterday:

As you can see, it is kinked at the 7 and 20 year maturities. Aside from that, from Fed funds out through 30 years it has a more normal shape. As I pointed out earlier, the 10 and 30 year maturities are typically where investors go to hide in a “flight to safety,” so that they have lower yields than some earlier maturities in those circumstances is not the classic yield curve inversion that has historically forecast trouble. That only happens when maturities in the short to medium range from 3 months out to 5 years start to invert.
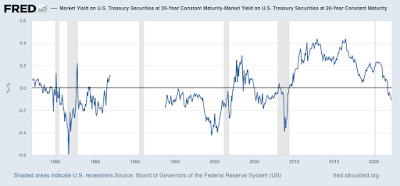
For example, here is the historical 30 year minus 20 year spread:

It has spent half of its existence inverted, including through most of the 1990s Boom.
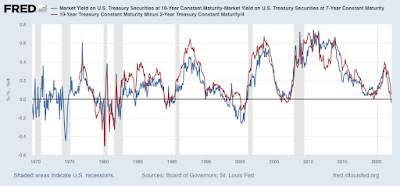
Here is the 10 year minus 7 year spread (blue) v. The 10 year minus 2 year spread (red, /4 for scale):

The 7 to 10 year spread gave a false signal in 1984, briefly in 1995, and spent virtually the entirety of the late 1990s tech Boom inverted. By contrast, the much more followed 2 to 10 year spread did not falsely signal in 1984 and 1995, but only missed during the 1966 near-recession and in 1998. It also properly gave a positive signal prior to the 2008-09 Great Recession, unlike the 7 to 10 year which just touched being flat for several days.
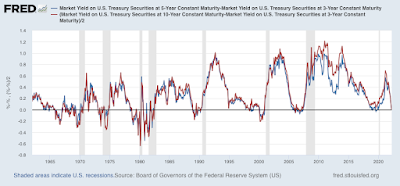
It is when we get closer to the short end of the curve, at 3 years, when things get more interesting. Below is the 3 to 5 year spread (blue) vs the 3 to 10 year spread (red, /2 for scale):

The result is very similar to the 2 to 10 year spread discussed above: the only misfires are during 1966, most of 1967-68, and briefly during 1998.
During the past week, the 3 to 5 year spread has not closed with an inversion, but the 3 to 10 year spread has twice. By contrast, the 2 to 10 year spread has not closed below 0.15%.
In summary, while the yield curve certainly merits heightened awareness, we haven’t seen the short to medium term inversions which in the past have demonstrated important signal vs. noise value.
