Scenes from the March jobs report; and the Great Resignation as “Take This Job and Shove It!” It’s been a little while since I took a more in-depth look at the jobs market, so let’s take a look. As I wrote last Friday, we are at historic lows in both the unemployment and underemployment rates. In the graphs below, the current values of each are normed to zero for easy comparison: Historically few people are involuntarily unemployed. So, how close are we to “full employment,” and what sectors haven’t caught up yet? As I wrote Friday, as of March we are only 1.579 million jobs short of where we were in February 2020 just before the pandemic hit. But since the population, and in particular the working age population has changed since
Topics:
NewDealdemocrat considers the following as important: resignation, US EConomics, US/Global Economics
This could be interesting, too:
NewDealdemocrat writes JOLTS revisions from Yesterday’s Report
Bill Haskell writes The North American Automobile Industry Waits for Trump and the Gov. to Act
Bill Haskell writes Families Struggle Paying for Child Care While Working
Joel Eissenberg writes Time for Senate Dems to stand up against Trump/Musk
Scenes from the March jobs report; and the Great Resignation as “Take This Job and Shove It!”
It’s been a little while since I took a more in-depth look at the jobs market, so let’s take a look.
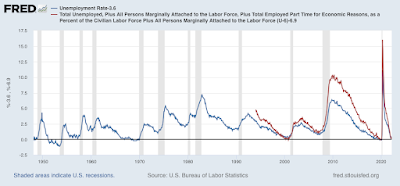
As I wrote last Friday, we are at historic lows in both the unemployment and underemployment rates. In the graphs below, the current values of each are normed to zero for easy comparison:
Historically few people are involuntarily unemployed.
So, how close are we to “full employment,” and what sectors haven’t caught up yet?
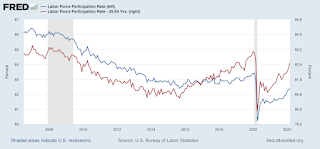
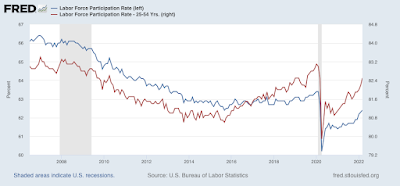
As I wrote Friday, as of March we are only 1.579 million jobs short of where we were in February 2020 just before the pandemic hit. But since the population, and in particular the working age population has changed since then, below I show the total labor force participation rate (that is, the % of the US population that is either employed or unemployed, vs. not in the labor force at all), and also the prime age (25-54 years old) labor force participation rate:
The total population LFPR is 62.4%, vs. 63.4% in February 2020, while the prime age LFPR is 82.5%. The former has declined sharply since 15 years ago, and has continued to decline, for a very simple reason: Boomers are old! When we focus on the prime age rate, that is only 05% short of its value as of February 2020. Since there are about 176 million Americans in that prime age demographic, that’s roughly a 0.9 million shortfall in that age group. If we figure there’s about another 60 million adults below the age of 65, the total is also probably around 1.5 million:
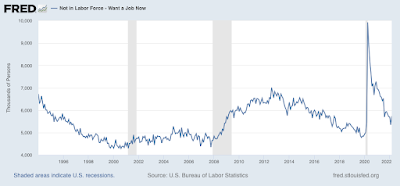
Similarly, when we look at the series “Not in Labor Force, Want a Job Now,” which is a pretty self-explanatory statistic, that is 5.737 million, also about 1.5 million above its best level just before the Great Recession:
In other words, all three ways of looking at the remaining jobs shortfall tell us that about 1.5 million more jobs need to be added to get to full pre-pandemic employment. We’ve been adding over 500,000 jobs a month, so if this continues for just 3 more months, we will have full employment.
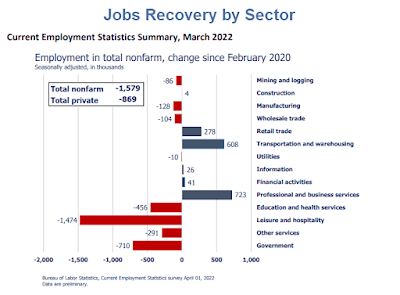
Turning the second question, the BLS itself has helpfully prepared the below graph of the gains and losses of various employment sectors since the pandemic started:
The usual suspects of leisure and hospitality (including food and drink), government, and education are still there, and manufacturing is still lagging.
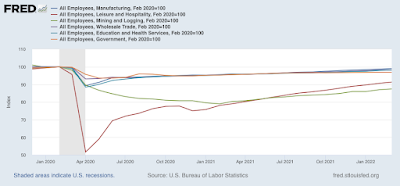
The above tells us the nominal shortfalls. What about the % of job losses? That’s what the below graph shows:
Surprisingly, on a %age basis, it’s mining and logging that has sustained the biggest losses, down -12.5%. Leisure and hospitality comes in next, down -8.7%. Government is down -3.1%, education is down -1.9%, wholesale trade is down -1.8%, and manufacturing is down -1.0%.
Finally, on the theme of “somebody is wrong on the internet,” Kevin Drum writes that “The Great Resignation was neither great nor a resignation,” citing work by the San Francisco Fed that “suggest that the high rate of quits is simply a reflection of the rapid pace of overall labor market recovery.”
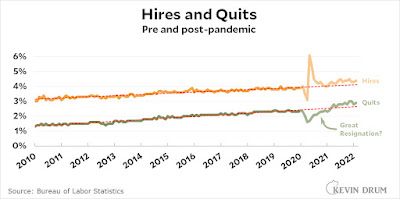
The San Francisco Fed makes an interesting case, citing historical manufacturing data. But my bone to pick is with Drum, who claims that “the quit rate [from the JOLTS report] merely rebounded to its old Great Recovery trendline . . .[or] merely … only very slightly above trend,” producing the below graph in support:
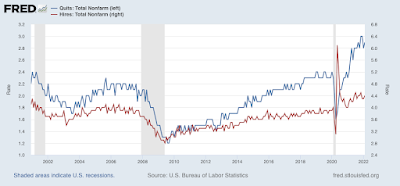
I submit that Drum’s choice of the bottom of the Great Recession as the starting point for his “trend” is performing some Olympic-level heavy lifting. By contrast, when we graph all the way back to the beginning of the statistic in 2000, here’s what it looks like:
The quits rate very suddenly jumped 25% higher than it had ever been in the previous 20 years (3.0%/2.4%=1.25). By contrast, hires, which had previously in Y2K been as high as 4.3%, and 4.1% in 2019, only increased to 0.2% above that to 4.5%.
So, hires barely budged, but quits jumped to all-time new highs by a very wide margin.
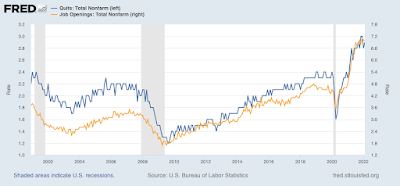
A better comparison is with job openings, which like quits soared to all-time highs as well, almost simultaneously with quits:
Drum’s claim is almost preposterous. The only difference is that the Great Resignation is less “I’m going to contemplate my navel” than “Take this job and shove it! [because I’ve found another one that pays way better].”

