House prices continued to surge through April; expect no meaningful moderation in the CPI anytime soon House price increases continued to go through the roof as of April, as reported this morning in both the Case Shiller and FHFA house price indexes. The Case Shiller national index rose another 2.1% for the month and 20.4% YoY, just 0.1% below last month’s biggest YoY% gain ever, while the FHFA purchase only index rose 1.6% for the month, and 18.8% YoY, below its peaks of 19.3% in February, and 19.4% last July. The YoY% changes for both for the past 5 years are shown below: Here is a longer term view, demonstrating that the current surge in house prices is the biggest in the past 30 years, surpassing even the housing bubble: Owners’
Topics:
NewDealdemocrat considers the following as important: CPI, Featured Stories, House prices, US EConomics, US/Global Economics
This could be interesting, too:
NewDealdemocrat writes JOLTS revisions from Yesterday’s Report
Ken Melvin writes A Developed Taste
Bill Haskell writes The North American Automobile Industry Waits for Trump and the Gov. to Act
Bill Haskell writes Families Struggle Paying for Child Care While Working
House prices continued to surge through April; expect no meaningful moderation in the CPI anytime soon
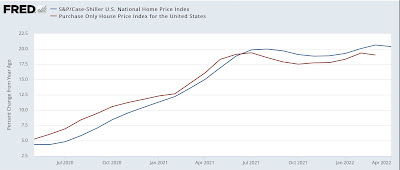
House price increases continued to go through the roof as of April, as reported this morning in both the Case Shiller and FHFA house price indexes. The Case Shiller national index rose another 2.1% for the month and 20.4% YoY, just 0.1% below last month’s biggest YoY% gain ever, while the FHFA purchase only index rose 1.6% for the month, and 18.8% YoY, below its peaks of 19.3% in February, and 19.4% last July. The YoY% changes for both for the past 5 years are shown below:
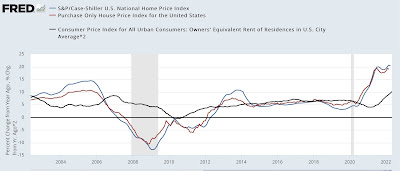
Here is a longer term view, demonstrating that the current surge in house prices is the biggest in the past 30 years, surpassing even the housing bubble:
Owners’ Equivalent Rent (x2 for scale, black) is also shown above. As I have pointed out many times, OER follows house price indexes with roughly a 12-18 month lag. OER has also risen to a 30 year record YoY high, and can be expected to accelerate further.
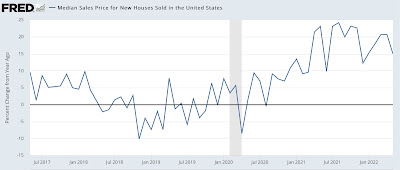
For further context, here is the YoY% change in median new home sales price from the Census Bureau in the past 5 years:
While I can’t show you graphically the YoY% change in prices in existing homes from the NAR since they only allow FRED to show one year, below are the YoY% changes for every month in median existing home sales prices for the past 13 months:
Apr 2021 +19.1%
May +23.6% [peak]
Jun +23%
Jul +20%
Aug +15%
Sep +13%
Oct +13.1%
Nov +13.9%
Dec 2021 +15.8%
Jan 2022+15.4%
Feb 2022 +15%
Mar 2022 +15%
Apr 2022 +10.4% [lowest]
May 2022 +14.8%
Since the NAR data is not seasonally adjusted, the YoY% change is the only valid way to measure it.
Last month the existing home sales increase gave some hope that house price gains were moderating. That still appears to be the case with regard to new homes. But there is very little evidence of moderation in either house price index.
And since OER plus rents contribute a full 1/3rd of the entire value of the CPI, and can be expected to accelerate further, I see very little reason to believe that, absent the Fed creating a recession, consumer inflation is going to abate meaningfully anytime soon.


