New home sales continue to fall sharply, while prices for both new and existing homes continues to increase sharply New home sales declined further in June to 590,000 annualized and May was revised sharply lower as well: This was the lowest number since the pandemic lockdown month of April 2020, and before that since December 2018. It is also over 40% lower than the peak reading of 1.036 sales annualized in August 2020. This is absolutely recessionary, as is easily seen in the above graph. The median price of a new home increased 1.7% in June (not seasonally adjusted), and remained sharply higher YoY at 15.1%: The FHFA and Case Shiller house price indexes were also released this morning. The also showed that house prices continued to
Topics:
NewDealdemocrat considers the following as important: Home Sales, New Deal Democrat, US EConomics
This could be interesting, too:
NewDealdemocrat writes JOLTS revisions from Yesterday’s Report
Bill Haskell writes The North American Automobile Industry Waits for Trump and the Gov. to Act
Bill Haskell writes Families Struggle Paying for Child Care While Working
Joel Eissenberg writes Time for Senate Dems to stand up against Trump/Musk
New home sales continue to fall sharply, while prices for both new and existing homes continues to increase sharply
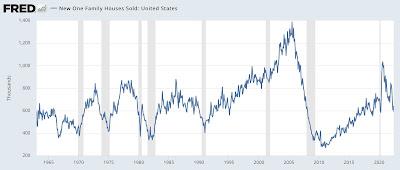
New home sales declined further in June to 590,000 annualized and May was revised sharply lower as well:

This was the lowest number since the pandemic lockdown month of April 2020, and before that since December 2018. It is also over 40% lower than the peak reading of 1.036 sales annualized in August 2020. This is absolutely recessionary, as is easily seen in the above graph.
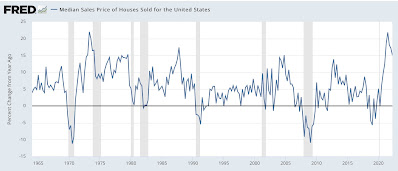
The median price of a new home increased 1.7% in June (not seasonally adjusted), and remained sharply higher YoY at 15.1%:

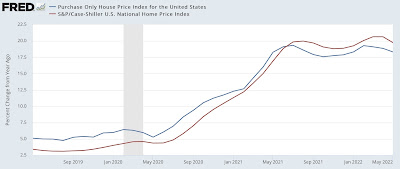
The FHFA and Case Shiller house price indexes were also released this morning. The also showed that house prices continued to increase sharply in May
The Case Shiller national index rose 1.0% for the month and 19.7% YoY, below last March’s 20.5%, which was the biggest YoY% gain ever. Meanwhile, the FHFA purchase only index rose 1.4% for the month, and 18.3 YoY, below its peaks of 19.3% in February, and 19.4% last July. The YoY% changes for both for the past 5 years are shown below:

While both are decelerating somewhat from their YoY peaks, they remain historically high.
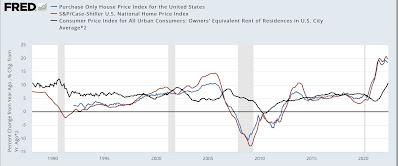
Here is a longer term view, demonstrating that the current surge in house prices is the biggest in the past 30 years, surpassing even the housing bubble:

Owners’ Equivalent Rent (x2 for scale, black) is also shown above. As I have pointed out many times, OER follows house price indexes with roughly a 12-18 month lag. OER has also risen to a 30 year record YoY high, and can be expected to accelerate further for several more months at least.
We saw last week that the median price of an existing home sold in June also increased 13.4% YoY, indicating that sharp increases in those prices had not yet abated.
As I have frequently pointed out, sales lead prices. Prices can continue to rise for even a year after prices peak. But with this kind of sales decline, I fully expect outright price declines to follow, and soon.
Additionally, since OER plus rents contribute a full 1/3rd of the entire value of the CPI, and can be expected to accelerate further, I see very little reason to believe that, absent the Fed creating a recession, consumer inflation (outside of gas prices) is going to abate meaningfully anytime soon.
