Coronavirus dashboard for October 21: the autumn lull continues, despite new subvariants – by New Deal democrat No economic data today, so let’s update the status of COVID-19. We are currently in a relative lull, with confirmed cases, hospitalizations, and deaths all near or at low levels only matched or exceeded at mid-year 2021 and early spring of this year. Here is the 6 month view of confirmed cases and deaths: At the moment deaths are averaging a little under 350/day, in the range of this spring’s lows. At 35,200, confirmed cases are down 75% from their June peak and at a 6 month low. Here is the long-term view since the beginning of the pandemic: As I wrote above, current levels are only higher than 3-4 months during the
Topics:
NewDealdemocrat considers the following as important: Autumn lull, Healthcare, Hot Topics, politics
This could be interesting, too:
Robert Skidelsky writes Lord Skidelsky to ask His Majesty’s Government what is their policy with regard to the Ukraine war following the new policy of the government of the United States of America.
NewDealdemocrat writes JOLTS revisions from Yesterday’s Report
Joel Eissenberg writes No Invading Allies Act
Ken Melvin writes A Developed Taste
Coronavirus dashboard for October 21: the autumn lull continues, despite new subvariants
– by New Deal democrat
No economic data today, so let’s update the status of COVID-19.
We are currently in a relative lull, with confirmed cases, hospitalizations, and deaths all near or at low levels only matched or exceeded at mid-year 2021 and early spring of this year.
Here is the 6 month view of confirmed cases and deaths:

At the moment deaths are averaging a little under 350/day, in the range of this spring’s lows. At 35,200, confirmed cases are down 75% from their June peak and at a 6 month low.
Here is the long-term view since the beginning of the pandemic:
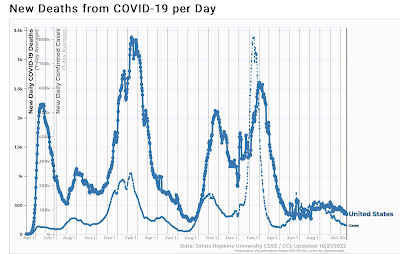
As I wrote above, current levels are only higher than 3-4 months during the entire past 2 years.
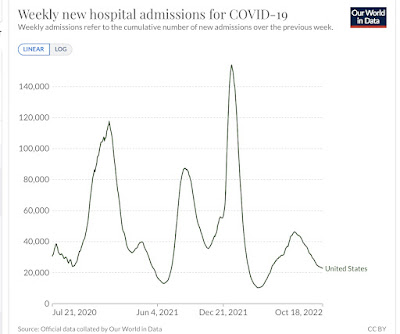
Similarly, hospitalizations have continued to decline to 24,000, just a little over half of what they were at their recent June peak, and only higher than 4 of the past 24 months:
BIobot’s wastewater analysis shows the West and South declining at low levels, the Midwest steady, and the Northeast also declining but from very elevated levels:
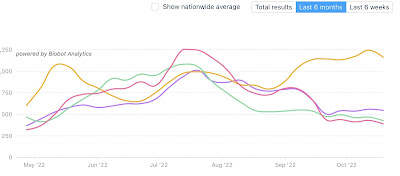
Nationwide (not shown), levels are consistent with about 225,000 “actual” cases of COVID daily.
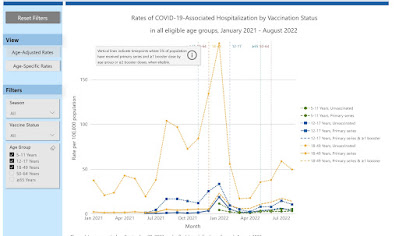
Demographically, as of August the biggest proportion of hospitalizations – by far – is among unvaccinated seniors, followed by the late middle-aged unvaccinated, and that followed closely by vaccinated seniors:
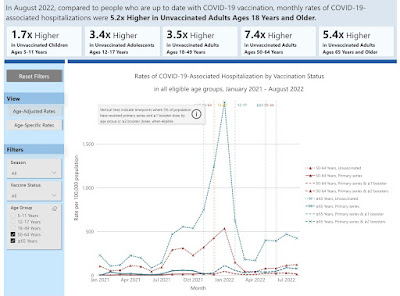
Aside from the unvaccinated younger middle-aged, everybody else has very minimal risk of hospitalization from COVID:
Finally, here is this week’s variant update from the CDC:
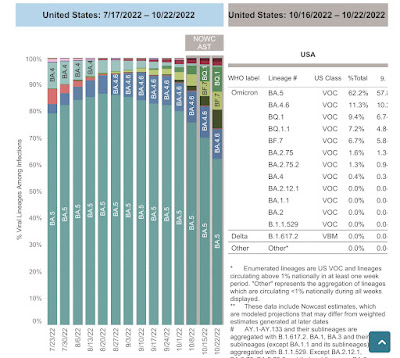
BA.5 continues to fade, and BA.4 is all but gone. The new alphabet soup of variants account for about 3/8’s of all cases, but since the number of cases has declined in the last 1 and 2 weeks, numerically the new subvariants altogether probably increased from an average of 11,000 to 13,000 cases daily. So far this looks much more like the BA.2.12.1 increase of late last spring rather than any major wave like Delta or the original Omicron.
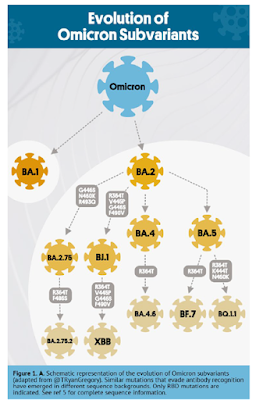
Which makes sense, since as this graphic shows, all of the new alphabet soup of variants are either “children” or “grandchildren” of BA.2, and most are also “children” of BA.5:
COVID-19 is somewhat seasonal. So we get spikes in the South in the summer, and in the NOrth during the winter, both coinciding with the time of the most indoor social activity. We will almost certainly get some kind of winter wave, but at may simply resemble the BA.2.12.1 wave from this past summer, rather than a monster wave like the last two winters.
“Coronavirus dashboard for October 5: An autumn lull as COVID-19 evolves towards seasonal endemicity,” Angry Bear.
“COVID heads toward endemicity,” Angry Bear.”
