September existing home sales and prices decline – by New Deal democrat With the exception of their big impact on prices, I do not particularly pay attention to existing home sales. Their economic impact is small compared with the construction of new homes; at best they add confirmation to a trend in new home sales, permits, and starts. In September, existing home sales did continue to decline, by 2%, to 4.71 million units annualized (Note: all the graphs except for one in this post come from Mortgage News Daily, and have not yet been updated with this morning’s September data): Their total decline from their January peak is a little over 25%, and -31% from their even higher peak in October 2020, in line with what we saw in yesterday’s
Topics:
NewDealdemocrat considers the following as important: Hot Topics, housing, New Deal Democrat, US EConomics
This could be interesting, too:
NewDealdemocrat writes JOLTS revisions from Yesterday’s Report
Joel Eissenberg writes No Invading Allies Act
Bill Haskell writes The North American Automobile Industry Waits for Trump and the Gov. to Act
Bill Haskell writes Families Struggle Paying for Child Care While Working
September existing home sales and prices decline
– by New Deal democrat
With the exception of their big impact on prices, I do not particularly pay attention to existing home sales. Their economic impact is small compared with the construction of new homes; at best they add confirmation to a trend in new home sales, permits, and starts.
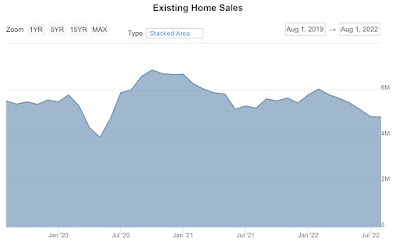
In September, existing home sales did continue to decline, by 2%, to 4.71 million units annualized (Note: all the graphs except for one in this post come from Mortgage News Daily, and have not yet been updated with this morning’s September data):

Their total decline from their January peak is a little over 25%, and -31% from their even higher peak in October 2020, in line with what we saw in yesterday’s Permits and Starts report.
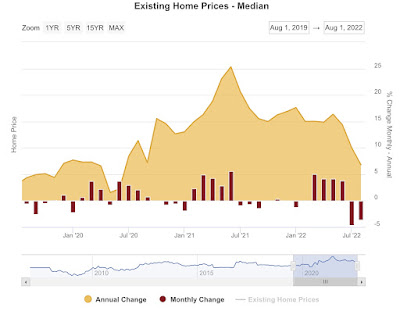
Prices declined for the month, but that is expected since they rise in the late winter and spring, and decline from summer into winter. More important is the YoY metric, and there prices rose 8.4% Note the big declines in July and August vs. prior years:

This is higher than last month’s 8.2% YoY, but lower than any other month in the past 2 years. It is also less than 1/2 of the biggest YoY% increase in the past year, which by my rule of thumb for non-seasonally adjustable data means that it is in decline from the absolute peak.
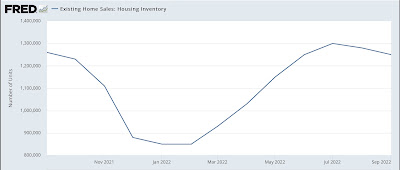
Inventory, which also is not seasonally adjusted, was slightly lower, by -0.8%, from one year ago:

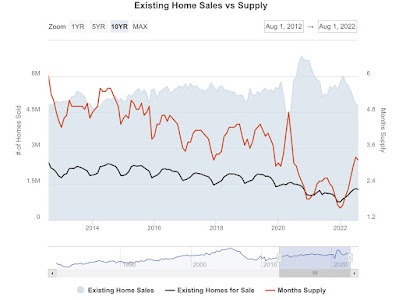
This has become a chronic problem, but usually inventory rises after prices begin to fall, as sellers are initially reluctant to accept that the $$$ peak is in. Here is what the longer term inventory data looks like:

Inventory has generally increased from 2021, but is still well below inventory before 2019.
In sum: September existing home sales is confirmatory evidence that sales have continued to decline, and that prices have started to decline as well. Total inventory has increased, while new listings are slightly lower than one year ago.
“August existing home sales: confirmation of housing prices peaking,” (angrybearblog.com), New Deal democrat.
“Existing home sales down 25%; price increases keep steamrolling on,” (angrybearblog.com), New Deal democrat.
