Scenes from the December jobs report: more deceleration – by New Deal democrat The only significant economic data this week will be released on Thursday, with both CPI and jobless claims. In the meantime, let’s take a closer look at the jobs data we got last Friday. As indicated in the title of this post, the theme was “deceleration.” First, here is the long term YoY look at total employment (blue), employment in goods-producing industries (red), and service providing (gold): Notice that goods-producing jobs are much more volatile; they decline first, while until the Great Recession, service providing jobs barely declined at all YoY even during recessions. Here is the close-up of the same since mid-2021: Service jobs came roaring
Topics:
NewDealdemocrat considers the following as important: politics, US EConomics, US/Global Economics
This could be interesting, too:
Robert Skidelsky writes Lord Skidelsky to ask His Majesty’s Government what is their policy with regard to the Ukraine war following the new policy of the government of the United States of America.
NewDealdemocrat writes JOLTS revisions from Yesterday’s Report
Joel Eissenberg writes No Invading Allies Act
Ken Melvin writes A Developed Taste
Scenes from the December jobs report: more deceleration
– by New Deal democrat
The only significant economic data this week will be released on Thursday, with both CPI and jobless claims. In the meantime, let’s take a closer look at the jobs data we got last Friday. As indicated in the title of this post, the theme was “deceleration.”
First, here is the long term YoY look at total employment (blue), employment in goods-producing industries (red), and service providing (gold):
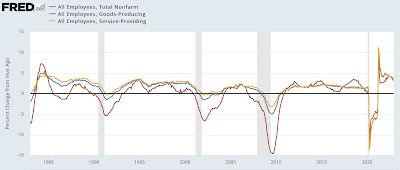
Notice that goods-producing jobs are much more volatile; they decline first, while until the Great Recession, service providing jobs barely declined at all YoY even during recessions.
Here is the close-up of the same since mid-2021:
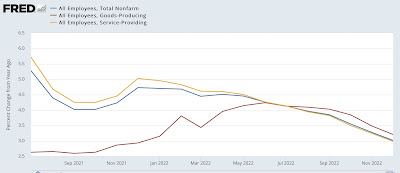
Service jobs came roaring back as things like restaurants reopened in 2021, while goods-producing jobs increased sharply as well during the Boom. Since spring 2022, there has been a consistent deceleration of YoY growth across the board (but still positive!). This going to levels that prior to the pandemic would have been consistered excellent.
Now let’s take a look at the leading sectors.
Manufacturers add and subtract working hours before they hire or lay off workers. So it’s no surprise that the manufacturing work week (red, YoY) is one of the 10 components of the Index of Leading Indicators. The number of manufacturing employees (blue) follows:
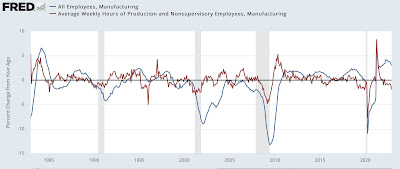
Notice again that the YoY growth in manufacturing employment now would be considered excellent at any time prior to the pandemic; while the decline in hours in the past has always been consistent with the onset of a recession.
But a look at the monthly change shows a break in the past several months, as employment gains are much lower than previously during the pandemic recovery:
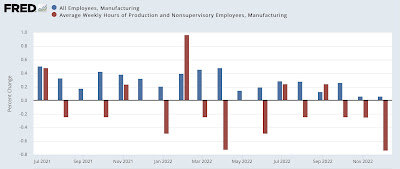
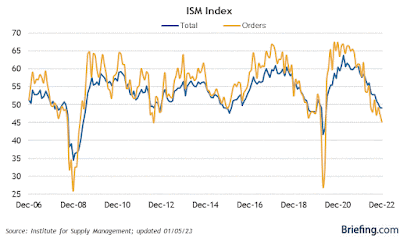
This is consistent with last week’s ISM manufacturing report for December, which showed both the total index and the new orders subindex consistent with the onset of recessions in the past:
And here’s a look at manufacturing hours, employment, and industrial production (gold), all normed to their recent peaks:
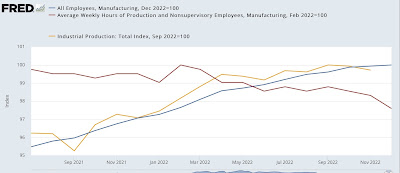
While employment is still growing slowly, production possibly peaked in October. It would not be a surprise if the employment gains in November and December were revised away.
Next, construction jobs (blue), and residential jobs in particular (gold) are also leading sectors. It is probably unsurprising that these have continued to grow, as housing units actually under construction (red) have continued to increase (due to the previous difficulty in obtaining construction materials like lumber):
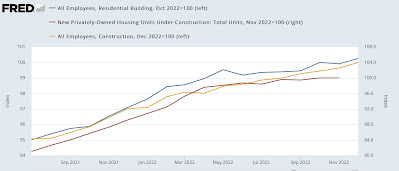
This is one of the definite bright spots in the economy. I do suspect it will roll over shortly, and perhaps fall off a cliff once the backlog is gone.
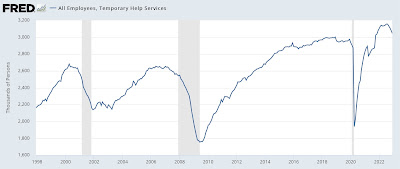
Temporary help jobs are also a leading jobs sector. They have already rolled over at a pace consistent in the past with the onset of recessions:
On a weekly basis I track the ASA’s Staffing Index, which has weakened considerably since last Labor Day:
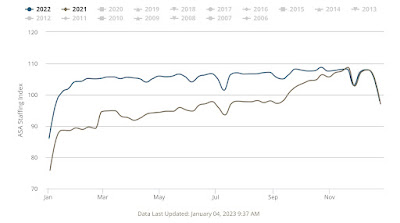
This index started in mid-2006. Here is what it looked like in 2007-08:
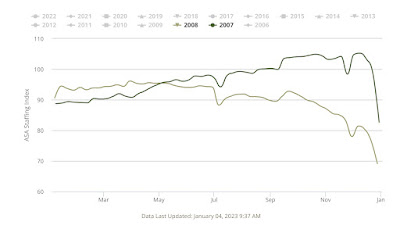
There have been instances since then of flat or even somewhat negative YoY growth in Staffing without a recession occurring; but the current reading of the index is consistent with a stalling economy, and consistent with the recent downturn in the monthly jobs report.
Next, as I have often pointed out, initial jobless claims (blue) lead the unemployment rate (red) by several months. Here’s the long term YoY view:
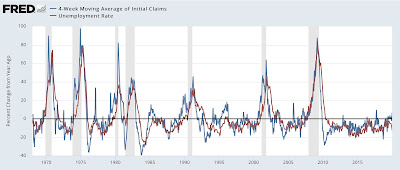
And here is the close up since mid-year 2021:
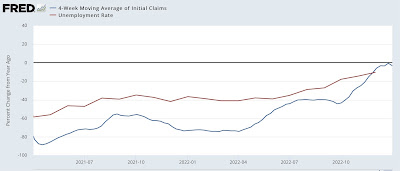
These are not at recessionary levels, but have definitely decelerated. I am currently watching to see if the 4 week average of initial claims moves higher YoY.
Finally, real aggregate payrolls turning negative YoY has been a very good indication of the onset of a recession. Here is the long term look at that, decomposed into nominal YoY payrolls vs. YoY inflation (so the recession signal is red line above blue line):
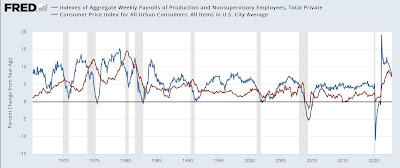
And here is the close up since mid-year 2021:
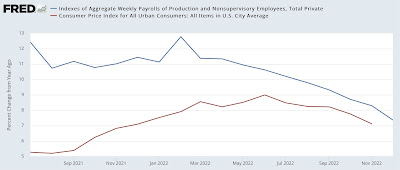
Both lines are decelerating, with CPI particularly assisted by the big decline in gas prices since June. As noted at the outset of this post, we’ll get December CPI on Thursday. I expect another good number, as gas prices declined sharply last month. If and when the decline in gas prices ends (quite possibly this month), the comparison is going to become much more challenging.
