The consumer may finally be faltering – by New Deal democrat At this point I think the “smart” econ take is that either any recession is very much delayed, or even not going to happen at all. While everything is possible, I’ve argued in several places that if you date a potential business cycle peak to January of this year, the data doesn’t look so rosy. To wit, below is a graph with all of the main monthly data series the NBER has said it relies upon normed to 100 as of January, with the exception of industrial production and real personal income, which are normed to their prior peaks of September 2022. The two quarterly series, real GDP and GDI, are normed to Q4 2022 to better show their increase/decrease in Q1 of this year: As of their
Topics:
NewDealdemocrat considers the following as important: Hot Topics, Recession 2023, US EConomics
This could be interesting, too:
NewDealdemocrat writes JOLTS revisions from Yesterday’s Report
Joel Eissenberg writes No Invading Allies Act
Bill Haskell writes The North American Automobile Industry Waits for Trump and the Gov. to Act
Bill Haskell writes Families Struggle Paying for Child Care While Working
The consumer may finally be faltering
– by New Deal democrat
At this point I think the “smart” econ take is that either any recession is very much delayed, or even not going to happen at all. While everything is possible, I’ve argued in several places that if you date a potential business cycle peak to January of this year, the data doesn’t look so rosy.
To wit, below is a graph with all of the main monthly data series the NBER has said it relies upon normed to 100 as of January, with the exception of industrial production and real personal income, which are normed to their prior peaks of September 2022. The two quarterly series, real GDP and GDI, are normed to Q4 2022 to better show their increase/decrease in Q1 of this year:

As of their last readings, industrial production, real manufacturing and trade sales, and real GDI are all below 100. Real personal income less government transfer payments is only 0.1% higher. The only series significantly higher are the Establishment and Household employment numbers, plus real personal spending. In fact, most of the Q1 increase in real GDP was the big increase in real personal spending in January.
Further, we can decompose real personal spending into goods vs. services spending, below:
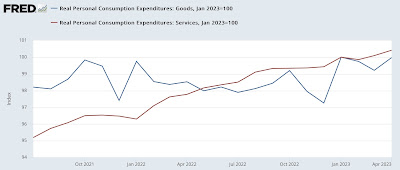
The *entirety* of the real personal spending increase since January has been on services, not goods (goods are very much affected by gas prices, so the increase in the 2nd half of last year was very much about the big decline in those prices).
So yesterday’s report of the ISM non-manufacturing index is unusually important.
Normally I don’t pay too much attention to this release, partly because it only has a 25 year history, partly because there were methodology revisions just as the 2008 recession hit, and partly because it is a nowcast rather than a leading indicator.
But yesterday’s report was the 3rd reading in a row below 52, at 50.3 (50 being the dividing line between expansion and contraction). Here is the long-term view of the entire series:
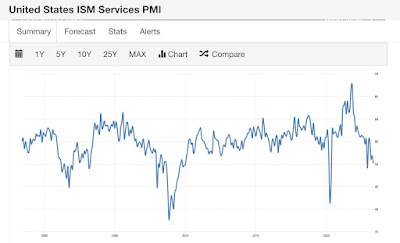
Two things ought to stand out as important: (1) this series crossed 50 to the downside right at the onset of the last 3 recessions, in May 2001, January 2008, and May 2020; and (2) the sharp decline in the values of this index also are comparable to the sharp declines just before or the onset of the 3 last recessions well.
In other words, this index looks now just like it has at the outset of all 3 recessions since it came into existence.
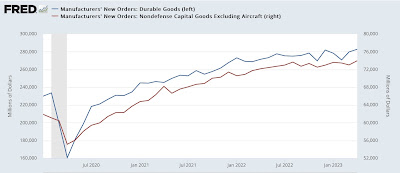
Yesterday the manufacturers’ new orders reports also came out. The good news is, both total new orders and core capital goods orders (leading indicators!) both made new all-time highs, at least in nominal terms:
But the consumer side showed declines for both durable and non-durable goods. Here’s the long-term view, showing declines in consumer durable goods (blue) before all 3 of the last recessions, and non-durables only following later:
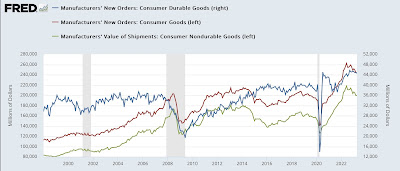
Here is the close-up since July 2021:
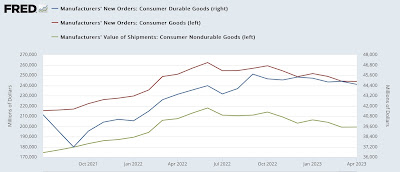
Non-durables have actually declined more than durables, but all are now in decline.
There’s no clear correlation between new consumer goods orders and consumer spending, but let me conclude with this. Here is the long-term view of the monthly % change in real personal spending up until the pandemic (the series only began in 2002):

And here is the same data since July 2021:

While there is usually at least one monthly decline each year, and occasionally 2 in a row, beyond that it only happened during the Great Recession. We’ve had 4 declines in the last 6 months.
Meanwhile, as I have been composing this piece, the weekly Redbook consumer spending report came out at +0.6% YoY, the weakest number since the pandemic recession:
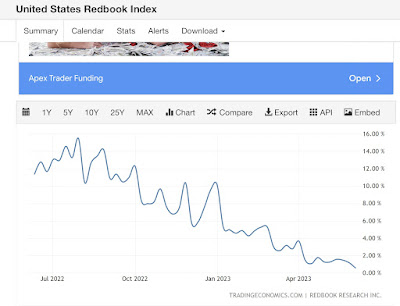
The consumer may finally be faltering.
Real hourly and aggregate wages update; plus further comments on consumer and producer inflation, Angry Bear, New Deal democrat
