MIdyear update: the state of the big monthly coincident indicators – by New Deal democrat Let’s take a look at the important monthly coincident indicators that the NBER has indicated they weight most heavily, along with quarterly real GDP, in gauging whether the economy is expanding or contracting. Remember, a recession isn’t actually defined by 2 quarters of negative GDP, but rather by a significant decline in jobs, income, sales, and production. Here is what all 5 monthly indicators look like, normed to 100 as of January, except for industrial production and real personal income less government transfers, which are normed to 100 as of their peaks last September: Industrial production is still below its level of last September, and total
Topics:
NewDealdemocrat considers the following as important: Coincident Indicators, Hot Topics, New Deal Democrat, US EConomics
This could be interesting, too:
NewDealdemocrat writes JOLTS revisions from Yesterday’s Report
Joel Eissenberg writes No Invading Allies Act
Bill Haskell writes The North American Automobile Industry Waits for Trump and the Gov. to Act
Bill Haskell writes Families Struggle Paying for Child Care While Working
MIdyear update: the state of the big monthly coincident indicators
– by New Deal democrat
Let’s take a look at the important monthly coincident indicators that the NBER has indicated they weight most heavily, along with quarterly real GDP, in gauging whether the economy is expanding or contracting. Remember, a recession isn’t actually defined by 2 quarters of negative GDP, but rather by a significant decline in jobs, income, sales, and production.
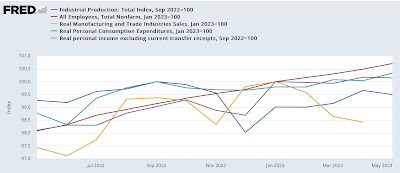
Here is what all 5 monthly indicators look like, normed to 100 as of January, except for industrial production and real personal income less government transfers, which are normed to 100 as of their peaks last September:

Industrial production is still below its level of last September, and total real sales below their peak this past January. Real personal spending is only 0.1% higher than it was in January.
The only significant increases are to real personal income, up 0.3% since last September, almost all of it due to May; and nonfarm payrolls, which have continued to rise sharply.
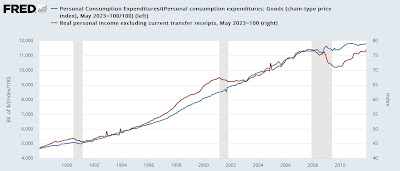
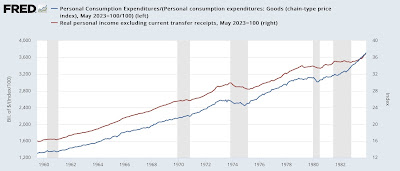
And to some extent we should discount increases in real personal income and spending that are not significant. As the two below graphs show, both metrics continued to rise during the recessions of 1970. Real personal income also rose in 1970, and was flat in 1982. Real spending rose in 1960, 1970, and 1982, and 2001 as well:


In other words, about half the time real income and spending were flat or even increased during the recessions of the past 60 years.
Subject as always to revisions, with the exception of nonfarm payrolls, which obviously remain very positive, the economy was a lot closer to recession during the first half of this year than most observers acknowledge.
Coincident indicators hold on, mainly due to improvement in gas prices YoY, Angry Bear, New Deal democrat
