Continuing claims near 2+ year high; likely the effect of Silicon Valley layoffs – by New Deal democrat Initial claims rose by 9,000 to a three month high of 224,000 last week. The four-week moving average also rose 5,350 to 207,750. With the usual one-week lag, however, continuing claims rose sharply, by 70,000, to 1.898 million, close to a 2+ year high: On the more important YoY% change basis, initial claims were up 12.6%, while the four-week average was up 4.1%, and continuing claims were up 14.3%: Although the one week average superficially would be a cause for concern, this comparison is against nearly all time lows set late in January 2023, as shown in the first graph above. In February 2023 claims rose to the 215-230,000
Topics:
NewDealdemocrat considers the following as important: Claims, Hot Topics, US EConomics
This could be interesting, too:
NewDealdemocrat writes JOLTS revisions from Yesterday’s Report
Joel Eissenberg writes No Invading Allies Act
Bill Haskell writes The North American Automobile Industry Waits for Trump and the Gov. to Act
Bill Haskell writes Families Struggle Paying for Child Care While Working
Continuing claims near 2+ year high; likely the effect of Silicon Valley layoffs
– by New Deal democrat
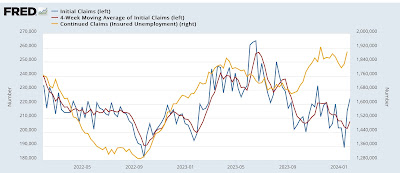
Initial claims rose by 9,000 to a three month high of 224,000 last week. The four-week moving average also rose 5,350 to 207,750. With the usual one-week lag, however, continuing claims rose sharply, by 70,000, to 1.898 million, close to a 2+ year high:
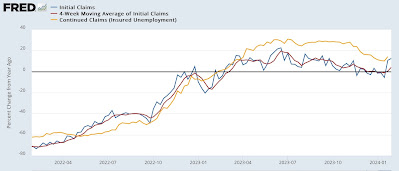
On the more important YoY% change basis, initial claims were up 12.6%, while the four-week average was up 4.1%, and continuing claims were up 14.3%:
Although the one week average superficially would be a cause for concern, this comparison is against nearly all time lows set late in January 2023, as shown in the first graph above. In February 2023 claims rose to the 215-230,000 level, so we would need to see claims rise to roughly 240,000 or more for this to be a real concern.
There had been some commentary a few months ago about the elevated YoY level of continuing claims. They certainly do suggest that some people are having trouble finding new employment. In this regard, periodically I check the California Department of Revenue for their analysis of income tax withholding payments. For January, they indicated a YoY decline of -1%.
Such a decline typically means an outright decline in nonfarm payrolls, in this case, for the State. We know that the explosive growth in Silicon Valley early in the pandemic has very much faded, with layoffs being in vogue. It seems likely that this is the source for both the decline in CA withholding tax payments, and the stubborn increase in continuing claims, as this one sector may well be in a recession.
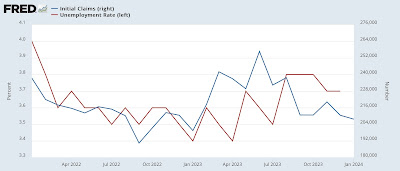
But updating the Sahm Rule analysis, January as a whole showed a continuing decline in initial claims from last spring and summer’s more elevated levels:
and since claims lead the unemployment rate, this suggests that in tomorrow’s report, as well as the next few months, unemployment is very unlikely to increase above 3.8%, and is more likely to decline towards 3.6% or even 3.5%.
Jobless claims up 14.6%, 4-week average up 11.8%, and continuing claims up 29.6%, Angry Bear, by New Deal democrat..


