A comment on median vs. mean, and job-stratified wage growth – by New Deal democrat Before today’s avalanche of data, I wanted to comment briefly on the Employment Cost Index for Q4 that was reported yesterday. This index has the advantage of weighting for type of employment. If low wage workers gain a disproportionate number of jobs, that will tend to hold down *average* wages. But the ECI hold the weighting of low, medium, and high wage jobs constant, so that it tells us how much pay for the *same job* varies from quarter to quarter. And because it is a median vs. average measure, it isn’t skewed by disproportionate gains at the very high end. The quarter over quarter change in the ECI is shown in red in the graph below, since the peak
Topics:
NewDealdemocrat considers the following as important: US EConomics, wage growth
This could be interesting, too:
NewDealdemocrat writes JOLTS revisions from Yesterday’s Report
Bill Haskell writes The North American Automobile Industry Waits for Trump and the Gov. to Act
Bill Haskell writes Families Struggle Paying for Child Care While Working
Joel Eissenberg writes Time for Senate Dems to stand up against Trump/Musk
A comment on median vs. mean, and job-stratified wage growth
– by New Deal democrat
Before today’s avalanche of data, I wanted to comment briefly on the Employment Cost Index for Q4 that was reported yesterday.
This index has the advantage of weighting for type of employment. If low wage workers gain a disproportionate number of jobs, that will tend to hold down *average* wages. But the ECI hold the weighting of low, medium, and high wage jobs constant, so that it tells us how much pay for the *same job* varies from quarter to quarter. And because it is a median vs. average measure, it isn’t skewed by disproportionate gains at the very high end.
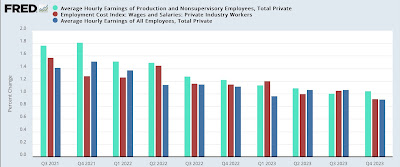
The quarter over quarter change in the ECI is shown in red in the graph below, since the peak in wage growth in 2021, compared with average nonsupervisory wage growth (light blue) and average total private wage growth (dark blue):
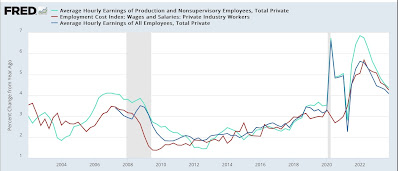
All three show deceleration, and all three are currently between 4.0% and 4.5% growth YoY, as shown in the graph below:
Note that average hourly wages spiked during the pandemic lockdown period, when low wage service workers were very disproportionately laid off. When they were rehired in 2021, and seemingly every retail business had a “help wanted” sign on their front window or roadside sign, average hourly wages for lower income, nonsupervisory workers spiked far more than other wages. By contrast, the wage paid for *the same work* was not affected by the pandemic layoffs, but did increase sharply as the unemployment rate fell to historical lows.
This “game of reverse musical chairs,” as I have called it over the past couple of years, has pretty much come to an end, and more typical wage growth for an expansion has ensued.
Tomorrow both average wage measures will be updated for January as part of the jobs report. I anticipate further deceleration.
The Big Story: a 100+ year near-record decline in commodity prices is enabling continued record wage growth and employment, Angry Bear, by New Deal democrat


