In which I read Paul Krugman, & once again find myself arguing myself into believing that the Federal Reserve ought to have spent this spring cutting interest rates . . . by Brad Delong Grasping Reality Newsletter AB: I receive some of Brad DeLong’s commentaries in my inbox. I read them and have not posted them because I feel guilty for doing so. The commentary (which includes Paul Krugman) if read carefully agrees with what some of us (which includes New Deal democrat) and you might believe may happen if The FED does not turn lose on interest rates. I agree with Brad. (and thank you Brad!) ~~~~~~~~ The PCE—Personal Consumption Expenditures—is the Federal Reserve’s preferred price level and inflation measure. The big point is that
Topics:
Angry Bear considers the following as important: Brad DeLong, politics, US EConomics
This could be interesting, too:
Robert Skidelsky writes Lord Skidelsky to ask His Majesty’s Government what is their policy with regard to the Ukraine war following the new policy of the government of the United States of America.
NewDealdemocrat writes JOLTS revisions from Yesterday’s Report
Joel Eissenberg writes No Invading Allies Act
Ken Melvin writes A Developed Taste
In which I read Paul Krugman, & once again find myself arguing myself into believing that the Federal Reserve ought to have spent this spring cutting interest rates . . .
by Brad Delong
Grasping Reality Newsletter
AB: I receive some of Brad DeLong’s commentaries in my inbox. I read them and have not posted them because I feel guilty for doing so. The commentary (which includes Paul Krugman) if read carefully agrees with what some of us (which includes New Deal democrat) and you might believe may happen if The FED does not turn lose on interest rates. I agree with Brad. (and thank you Brad!)
~~~~~~~~
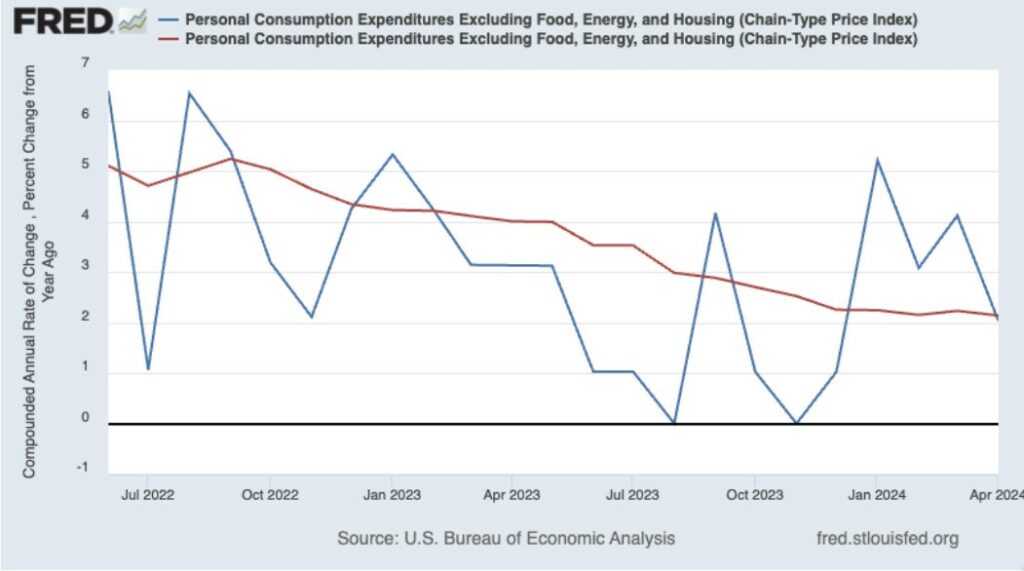
The PCE—Personal Consumption Expenditures—is the Federal Reserve’s preferred price level and inflation measure. The big point is that while the CPI—Consumer Price Index—tracks out-of-pocket expenditures, the PCE keeps track about how consumers shift spending when one of a pair of close substitute commodities change in price and the other one doesn’t. and also covers a broader range of goods and services, including, among other things, medical care paid by employer-provided insurance and Medicare/Medicaid. The core PCE plotted above omits food and energy not because people do not buy them, but because there is a long historical track record that tells us that future inflation is much better forecast by core inflation than by the full headline index.
Paul here removes housing from core PCE inflation because “official measures of housing costs are very much a lagging indicator, reflecting a surge in rents that ended more than a year ago…. It may make sense to exclude housing costs… because a measure excluding shelter may be a [still] better predictor of future inflation…”
In both graphs, the blue line shows the month-to-month inflation rate, while the red line shows the average inflation rate over the entire past year.
Paul’s conclusion? This:
It looks as if underlying inflation is probably between 2 percent and 3 percent and the hot numbers earlier this year were a false alarm. We may or may not have brought inflation all the way back to the traditional (but arbitrary) target, but inflation really doesn’t look as if it should be a major preoccupation at this point . . . Inflation . . . increasingly looks like yesterday’s problem, and start worrying about the possibility of a recession as the economy’s strength finally begins to erode under the strain of high interest rates…
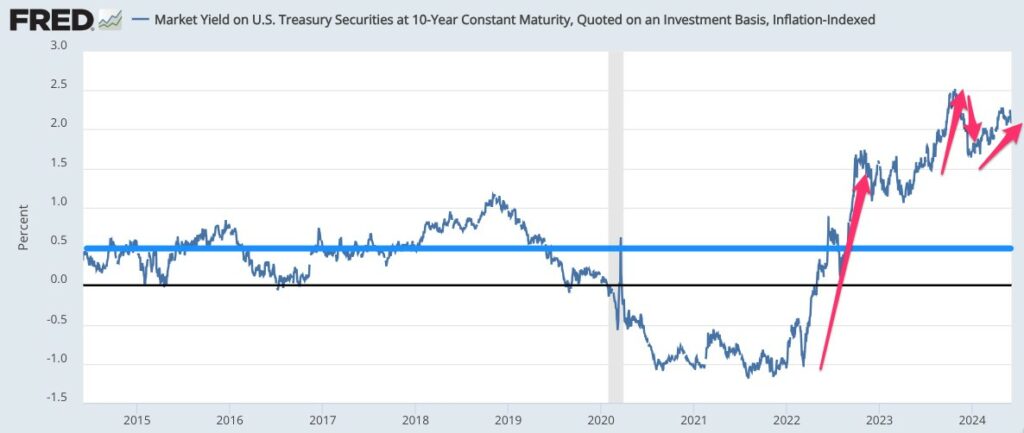
Why is Paul worried about the level of interest rates? Another FRED graph:
The ten-year real interest rate on U.S. Treasury securities is way above anything you might see as its equilibrium value in the entire decade of the 2010s, and way above what it was even when it was clear in late 2021 and early 2022 that the economy was rapidly approaching full employment. Since early 2022, we have had:
- The jump-up in the 10-Year Treasury real rate from -1.0% to +1.5% as the Fed moved to tighten and people recognized the magnitude of that tightening.
- A late-2023 jump-up in the 10-Year Treasury real rate from +1.5% to +2.5% as markets decided that the Federal Reserve was indeed hell-bent at pushing inflation below 2%/year even at a substantial risk of a large recession.
- A year-cusp fall in the 10-Year Treasury real rate from +2.5% down to +1.75% as markets decided that the Federal Reserve was not going to do that, but was instead going to cut short-term interest rates by up to 1.5% in calendar year 2024.
- The recent creep-up in the 10-Year Treasury real rate from +1.75% to +2.25% as markets decided that the Federal Reserve was going to keep interest rates higher for longer.
The argument that the equilibrium neutral real interest rate r* has jumped up from its +0.5% level of the 2010s to the +1.5% it attained in late 2022 is that four things have happened:
- A tremendous expansion in the debts of high-quality trusted governments has significantly eroded the safety premium.
- Large and apparently permanent government deficits are a substantial fiscal-ease factor that needs to be offset by monetary stringency.
- The world’s economic growth configuration has shifted from investment-light to investment-heavy, with the rotation into the leading sector role of decarbonization energy and computation-heavy tech.
- Over and above (3), irrational exuberance in financial markets has eased financial conditions in a way that needs to be offset by additional monetary stringency.
These may or may not have happened.
But even if all of these have happened, what has happened since mid-2023 to raise r* from +1.5% to +2.25%? The only thing is that the U.S. economy has powered ahead without economic growth weakening much. But my rough guideline is that monetary policy’s effects on real spending and employment work with a long and variable lag averaging 18 months. Monetary policy became tight in October 2022. 18 months from then is April 2024. We are just now starting to get data from May 2024.
Am I wrong to wish that the Federal Reserve had cut short-term interest rates this spring in order to keep the Ten-Year Treasury real rate around +1.5%?


