Summary:
by New Deal democrat A quick primer on interest rates and rate hikes With increasing speculation that the Fed will again raise interest rates this month, I thought I would take a look at how long term rates, and the yield curve, react. As most everybody who follows this stuff knows, in the last 60 years the yield curve has always inverted before the onset of a recession — which presumably means that it narrows before it inverts. But *how* does it narrow? Do long term interest rates come down, do short term rates go up, or is there some of each? Let’s go to the graphs. Below are the yields on 10 year treasuries (blue), the Fed funds rate (green), and YoY consumer inflation (red), first from 1962 to 1983: and from 1983 to the present: There are a few trends that have remained true during both the earlier, inflationary era, and the more recent disinflationary and deflationary era. First, all three generally move in the same direction, i.e., both long and short term interest rates tend to broadly correlate with the inflation rate. Second, in terms of volatility: - long term interest rates are least volatile - the YoY inflation rate is next - the Fed funds rate is the most volatile.
Topics:
Dan Crawford considers the following as important: Featured Stories, US/Global Economics
This could be interesting, too:
Ken Melvin writes A Developed Taste
Joel Eissenberg writes How Tesla makes money
Angry Bear writes True pricing: effects on competition
Angry Bear writes The paradox of economic competition
by New Deal democrat
A quick primer on interest rates and rate hikes
With increasing speculation that the Fed will again raise interest rates this month, I thought I would take a look at how long term rates, and the yield curve, react.
As most everybody who follows this stuff knows, in the last 60 years the yield curve has always inverted before the onset of a recession — which presumably means that it narrows before it inverts.
But *how* does it narrow? Do long term interest rates come down, do short term rates go up, or is there some of each?
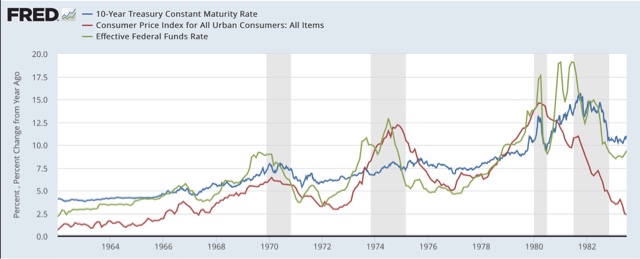
Let’s go to the graphs. Below are the yields on 10 year treasuries (blue), the Fed funds rate (green), and YoY consumer inflation (red), first from 1962 to 1983:
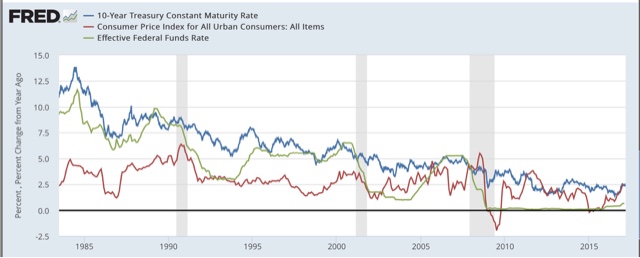
and from 1983 to the present:
There are a few trends that have remained true during both the earlier, inflationary era, and the more recent disinflationary and deflationary era.
First, all three generally move in the same direction, i.e., both long and short term interest rates tend to broadly correlate with the inflation rate.
Second, in terms of volatility:
- long term interest rates are least volatile
- the YoY inflation rate is next
- the Fed funds rate is the most volatile.
Finally, in each case over the last 60 years, before a recession the yield curve has inverted because the Fed funds rate rose to and overtook long term rates. In the inflationary era, both continued to rise into the recession. In the more recent era, long term rates have been flat or declined slightly once there was an inversion.
Contrarily, the few times that long term rates declined to the level of the Fed funds rate (1986, 1994, 1998) it did *not* signal a recession, but rather a correction in a strong economy.
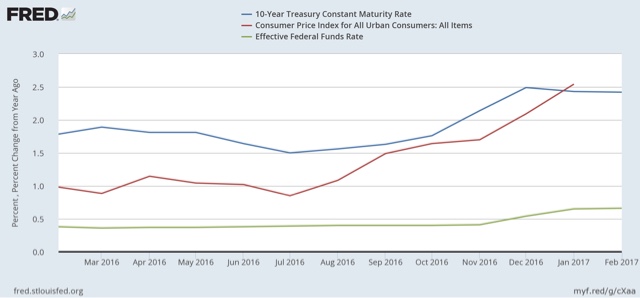
So let’s take a look at the last 12 months:
Since the end of June, long term rates have actually risen more than short term rates, and have risen to over 2.5% again this week. This is the sign of a relatively strong economy, at least over the shorter term 6 – 12 months. Short rates have a long ways to go before they overtake long term rates. Of course, if long term rates rise high enough, that will act to choke off the housing market and will set up longer term weakness. But we’re not there yet.


