Marginalized populations and employment during expansions Dean Baker ran a graph over the weekend showing an apparent conundrum: namely, that in the last several years there has been an increase in the percentage of those employed who only have a high school diploma vs. a slight *decrease* in employment among those with a college degree. Here’s his graph: This caught my attention, because I actually don’t think this is such an anomaly. So I went back and checked. The data posted by Prof. Baker has only been published since 1992, so we don’t have a long track record. But it is interesting to note that a similar pattern asserted itself in the 1990s. Take a look: As the economy began to take off – in particular beginning in 1994 - the e/p ratio of college
Topics:
NewDealdemocrat considers the following as important: US/Global Economics
This could be interesting, too:
Joel Eissenberg writes How Tesla makes money
Angry Bear writes True pricing: effects on competition
Angry Bear writes The paradox of economic competition
Angry Bear writes USMAC Exempts Certain Items Coming out of Mexico and Canada
Marginalized populations and employment during expansions
Dean Baker ran a graph over the weekend showing an apparent conundrum: namely, that in the last several years there has been an increase in the percentage of those employed who only have a high school diploma vs. a slight *decrease* in employment among those with a college degree. Here’s his graph:
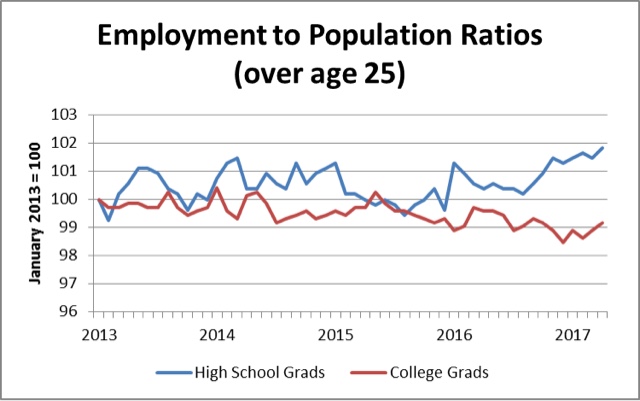
This caught my attention, because I actually don’t think this is such an anomaly. So I went back and checked.
The data posted by Prof. Baker has only been published since 1992, so we don’t have a long track record. But it is interesting to note that a similar pattern asserted itself in the 1990s. Take a look:
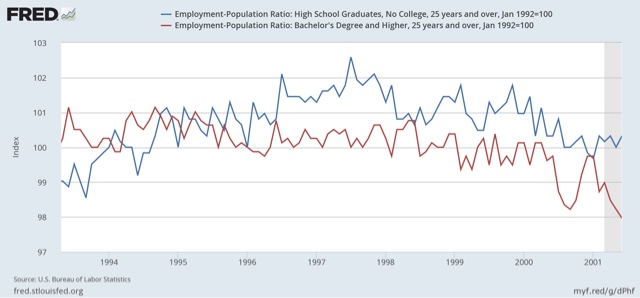
As the economy began to take off – in particular beginning in 1994 - the e/p ratio of college graduates actually declined by about 1%, while the employment rate of persons with only a high school diploma increased.
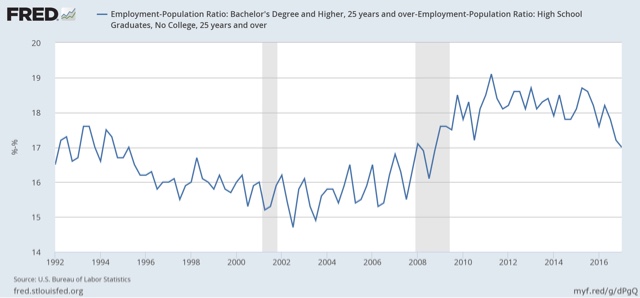
Here is another look at the same data, showing the amount by which the e/p ratio for those with college degrees has historically exceeded those with only high school diplomas:
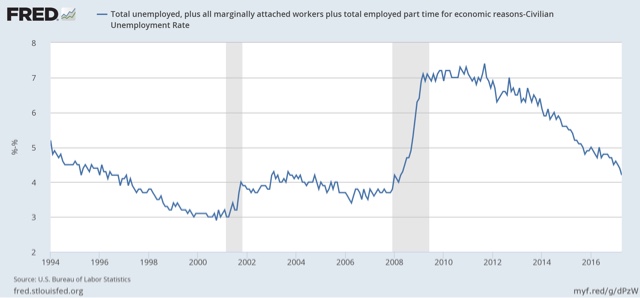
This is part of a broader picture. We get the same pattern when we compare U6 underemployment with U3 unemployment, as in the below graph which shows the amount by which U6 has historically exceeded U3:
Another marginalized group is African Americans, and here, we have longer data, going back to 1972. The below graph shows the amount by which black unemployment has historically exceeded white unemployment:
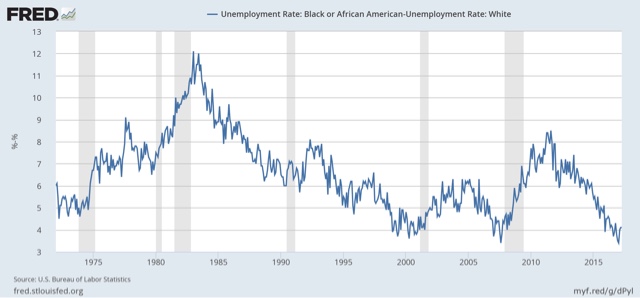
It’s the same pattern. As the economy improves during an expansion, more and more marginal, and marginalized, potential employees find work.
These same groups typically are first to feel a downturn, so the fact that the data in Prof. Baker’s graph hasn’t started to reverse is good news.