Summary:
November Jobs Report: good month, same caveats HEADLINES: +228,000 jobs added U3 unemployment rate unchanged at 4.1% U6 underemployment rate rose +0.1% from 7.9% to 8.0% Here are the headlines on wages and the chronic heightened underemployment: Wages and participation rates Not in Labor Force, but Want a Job Now: rose +53,000 from 5.175 million to 5.238 million Part time for economic reasons: rose +48,000 from 4.753 million to 4.801 million Employment/population ratio ages 25-54: rose +0.2% from 78.8% to 79.0% Average Weekly Earnings for Production and Nonsupervisory Personnel: rose +$.0.5 from a downwardly revised .19 to .24, up +2.4% YoY. (Note: you may be reading different information about wages elsewhere. They are citing average wages for
Topics:
NewDealdemocrat considers the following as important: US/Global Economics
This could be interesting, too:
Joel Eissenberg writes How Tesla makes money
Angry Bear writes True pricing: effects on competition
Angry Bear writes The paradox of economic competition
Angry Bear writes USMAC Exempts Certain Items Coming out of Mexico and Canada
November Jobs Report: good month, same caveats
HEADLINES:
- +228,000 jobs added
- U3 unemployment rate unchanged at 4.1%
- U6 underemployment rate rose +0.1% from 7.9% to 8.0%
Here are the headlines on wages and the chronic heightened underemployment:
Wages and participation rates
- Not in Labor Force, but Want a Job Now: rose +53,000 from 5.175 million to 5.238 million
- Part time for economic reasons: rose +48,000 from 4.753 million to 4.801 million
- Employment/population ratio ages 25-54: rose +0.2% from 78.8% to 79.0%
- Average Weekly Earnings for Production and Nonsupervisory Personnel: rose +$.0.5 from a downwardly revised $22.19 to $22.24, up +2.4% YoY. (Note: you may be reading different information about wages elsewhere. They are citing average wages for all private workers. I use wages for nonsupervisory personnel, to come closer to the situation for ordinary workers.)
Holding Trump accountable on manufacturing and mining jobs
Trump specifically campaigned on bringing back manufacturing and mining jobs. Is he keeping this promise?
Trump specifically campaigned on bringing back manufacturing and mining jobs. Is he keeping this promise?
- Manufacturing jobs rose by +31,000 for an average of +15,000 a month vs. the last seven years of Obama’s presidency in which an average of 10,300 manufacturing jobs were added each month.
- Coal mining jobs fell -400 for an average of -15 a month vs. the last seven years of Obama’s presidency in which an average of -300 jobs were lost each month
September was revised upward by +20,000. October was revised downward by -17,000, for a net change of +3,000.
The more leading numbers in the report tell us about where the economy is likely to be a few months from now. These were mixed.
- the average manufacturing workweek was unchanged at 40.9 hours. This is one of the 10 components of the LEI.
- construction jobs increased by +24,000. YoY construction jobs are up +184,000.
- temporary jobs increased by +16,300.
- the number of people unemployed for 5 weeks or less increased by +121,000 from 2,129,000 to 2,250,000. The post-recession low was set al,ost two years ago at 2,095,000.
Other important coincident indicators help us paint a more complete picture of the present:
-
- Overtime was unchanged at 3.5 hours.
- Professional and business employment (generally higher- paying jobs) increased by +46,000 and is up +548,000 YoY.
- the index of aggregate hours worked in the economy rose by 0.1% from 115.4 to 115.5.
- the index of aggregate payrolls rose by 0.4% from 171.1 to 171.7.
Other news included:
- the alternate jobs number contained in the more volatile household survey increased by +183,000 jobs. This represents an increase of- 1,187,000 jobs YoY vs. 2,071,000 in the establishment survey.
- Government jobs rose by 7,000.
- the overall employment to population ratio for all ages 16 and up fell -0.1% from 60.2% to 60.1 m/m and is up + 0.3% YoY.
- The labor force participation rate was unchanged m/m and is also unchanged YoY at 62.7%
SUMMARY
This was a good report on most metrics. Under the headlines, it was slightly weaker than apparent. While the prime age participation rate rose to a new expansion high, measures of underemployment weakened slightly.
Meanwhile, the revisions were of particular interest. September was initially reported as a loss, the first in 7 years, but is now +38,000. Also, there is a question as to whether we should still take into account the hurricanes, since in the past it has been reported that the aftereffects last more than 2 months. In this regard, the three month average of +170,000 is in line with the pre-hurricane average.
As usual, wage gains for nonsupervisory workers continue to stink.
So: a good report, doing nothing to alter my opinion that we are late in the expansion, and that the next recession is at grave risk of including actual wage deflation.
From Bonddad
A few points:
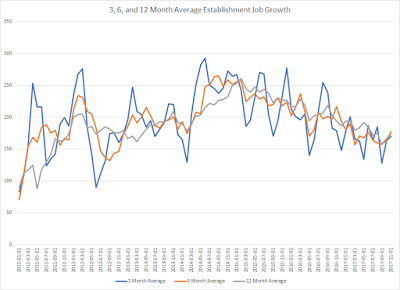
The 3, 6, and 12-month moving average of establishment job growth are all about 170. However, notice that all three area moving sideways for the most of this year. This tells us the economy will probably continue to print at this level (on average, of course) for the next few months
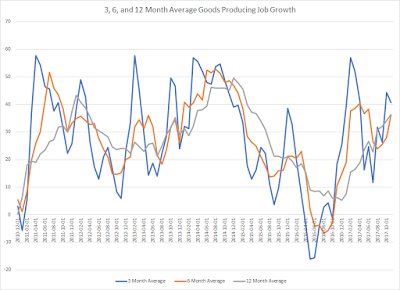
The 3, 6, and 12-month moving average of goods-producing jobs are all moving higher. This is good news, but there’s a caveat; notice the left-hand scale, which is in the 10,000s. So 40 is 40,000 Put another way, there just aren’t that many jobs in the goods-producing sector of the economy.
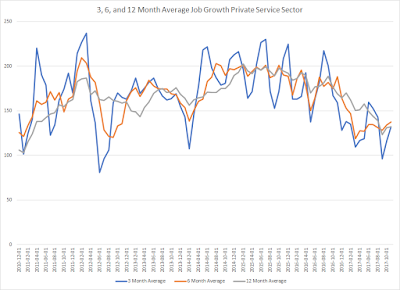
The service-producing sector is also growing, but the overall pace is clearly declining, which we also see in the Y/Y percentage change:
Let’s turn to a few household report numbers:
The employment/population ratio is still moving higher
But the LFPR is still moving sideways.


