Yesterday (Aug. 29) in the Q2 GDP update corporate profits were reported for the first time. Since corporate profits are one of four long leading indicators identified by Prof. Geoffrey Moore, I have updated my look at them at Seeking Alpha. Usual shameless plug: reading this isn’t just educational, it puts a few pennies in my pocket. But of course corporate profits are a good way to measure how the producer sector is doing compared with ordinary workers. So below is a graph of corporate profits (green), the S&P 500 (blue), average hourly wages for non-managerial workers (dark red), and aggregate wages for all of those workers (light red), since the month Trump took office: Profits are up over 17% and stock prices up over 22%. Meanwhile
Topics:
NewDealdemocrat considers the following as important: Taxes/regulation, US/Global Economics
This could be interesting, too:
Joel Eissenberg writes How Tesla makes money
Angry Bear writes True pricing: effects on competition
Angry Bear writes The paradox of economic competition
Angry Bear writes USMAC Exempts Certain Items Coming out of Mexico and Canada
Yesterday (Aug. 29) in the Q2 GDP update corporate profits were reported for the first time.
Since corporate profits are one of four long leading indicators identified by Prof. Geoffrey Moore, I have updated my look at them at Seeking Alpha.
Usual shameless plug: reading this isn’t just educational, it puts a few pennies in my pocket.
But of course corporate profits are a good way to measure how the producer sector is doing compared with ordinary workers. So below is a graph of corporate profits (green), the S&P 500 (blue), average hourly wages for non-managerial workers (dark red), and aggregate wages for all of those workers (light red), since the month Trump took office:
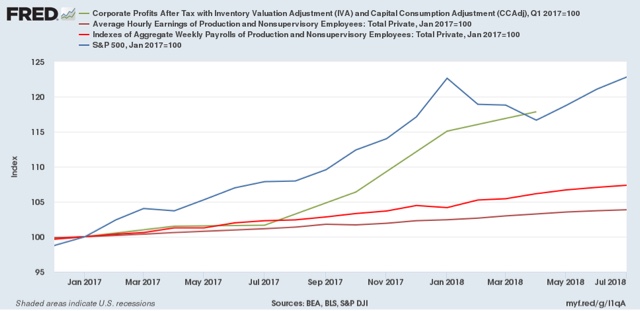
Profits are up over 17% and stock prices up over 22%. Meanwhile average workers’ hourly earnings are up (before inflation) less than 3%, and even in the aggregate are up only 7%.
And the Fed is worried about wage inflation.