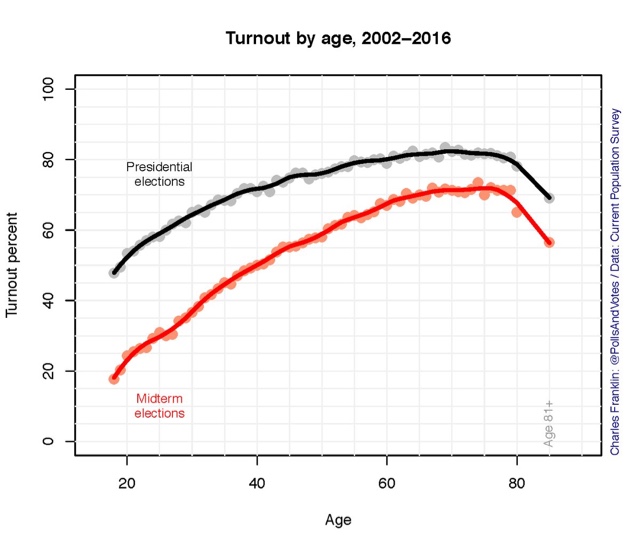
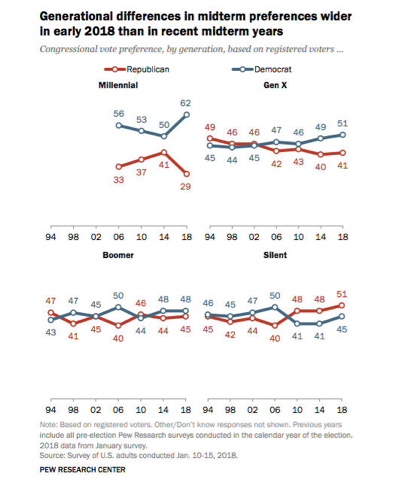
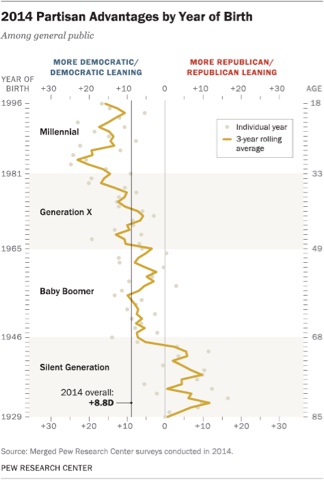
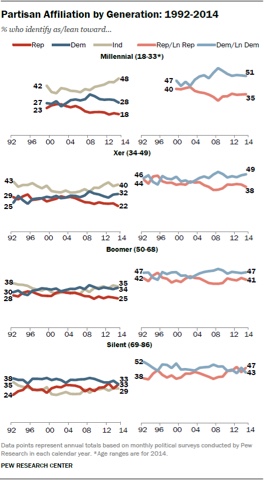
(Dan here…Better late than never!) A thought for Sunday: the march of demographics and the 2018 midterms Below is a graph showing that the older the demographic (up until age 80), the bigger the turnout during midterm elections. The data behind this graph isn’t just from 2014, but from a series of midterm elections over time — in other words, it has been durable over time. My purpose in this post is show that, even if these percentages hold in this year’s midterms, the electorate is going to skew considerably less “red” than it did in either 2010 or 2014. To start with, here is the widely reprinted graph from a recent Pew study, showing that, generally, the younger the demographic, the more liberal on social issues and the more Democratic the
Topics:
Dan Crawford considers the following as important: politics, Taxes/regulation, Uncategorized, US/Global Economics
This could be interesting, too:
tom writes The Ukraine war and Europe’s deepening march of folly
Robert Skidelsky writes Lord Skidelsky to ask His Majesty’s Government what is their policy with regard to the Ukraine war following the new policy of the government of the United States of America.
Stavros Mavroudeas writes CfP of Marxist Macroeconomic Modelling workgroup – 18th WAPE Forum, Istanbul August 6-8, 2025
Lars Pålsson Syll writes The pretence-of-knowledge syndrome
(Dan here…Better late than never!)
A thought for Sunday: the march of demographics and the 2018 midterms
Unfortunately, while dividing age cohorts into only four may make for a clean graph, it paints with far too broad a brush, and has led to some misguided generational bashing online. So let’s take a more granular look.
There is lots of evidence that most people form their bedrock political outlook in their late teens. Basically, if at age 18 or so, there is peace and prosperity, you are likely to embrace the ideology of the party of the President. Conversely, if the economy is performing poorly or there is social upheaval, you are likely to embrace the ideology of the opposition.
Importantly, when we slice age cohorts more finely, we find two things:
2. the outsized conservatism of the age 60-80 cohort most likely to vote in midterms is a happenstance of the last decade or so, and will have faded significantly by election day this year.
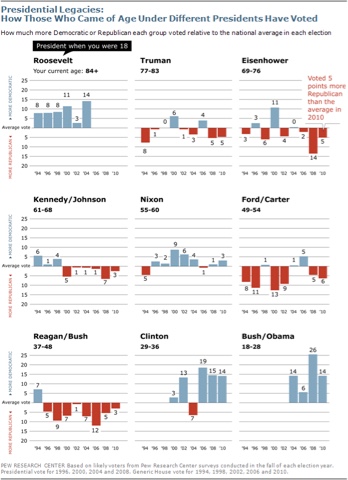
The below graph dating from 2012, which breaks down voting cohorts by the Presidency during which they turned 18 years of age for the election from 1994 through 2010:
Quick, which is the most liberal demographic? Obviously, it’s the Greatest Generation, isn’t it?
They remained durably Democratic until they passed away (even now there are still about 2 million alive).
So much for turning more conservative with age!
Next, comparing the first four elections with the four most recent elections (3 vs. 3 in the case of the Clinton cohort), only 4 demographic groups become more conservative over time: Truman, Eisenhower, Kennedy/Johnson, and Reagan/Bush. Three — Nixon, Ford/Carter, and Clinton — have voted more Democratic over time.
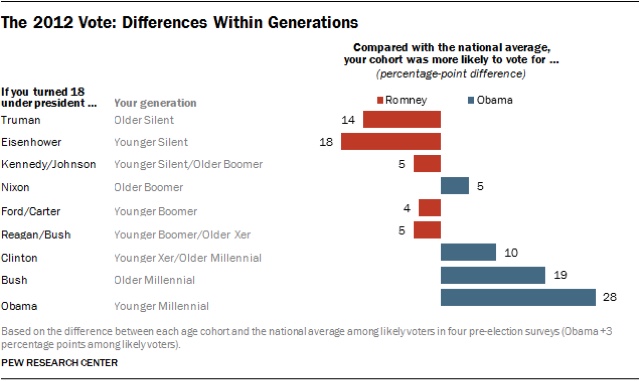
The generational pattern continued in the Presidential election of 2012. The Greatest generation was gone, and the mid-Boomer Nixon cohort stands out as a Democratic leaning demographic:
The twhree graphs together show that, confounding received wisdom, over time it has been the Gen X and late Boomer cohorts who came of age from 1975-92 who are the most reliably conservative groups, whereas the mid-Boomer cohort that came of age during the Nixon years has been reliably liberal. [UPDATE: Early Gen Xers may be the exception to the rule, as in 2014 and 2016, they trended blue vs. their earlier solid red record. Possibly the GOP’s embrace of rabid retrograde social reaction has been too much for them. The remaining cohorts all continued to vote in 2014 and 2016 in accord with their earlier records.]
With no other information at all, the fact that the deep blue Greatest generation passed from the scene after 2006, and were replaced with more conservative cohorts in the age 60-80 group that votes most heavily in midterms, suggested that those two elections would skew more deeply “red” than any other recent elections.
This year all the Truman cohort and the first 1/4 of the Eisenhower cohort are over age 80, when presumably frail health causing voting participation in midterms to decline precipitously, and have been replaced in the most heavily voting bloc by the “blue” Nixon cohort. Meanwhile the blue Clinton cohort is moving past age 40 and can be expected to vote in greater numbers, at a rate roughly equal to that of the Truman and Eisenhower cohorts.
That alone should shift the demographics of this year’s midterm electorate more bluish.
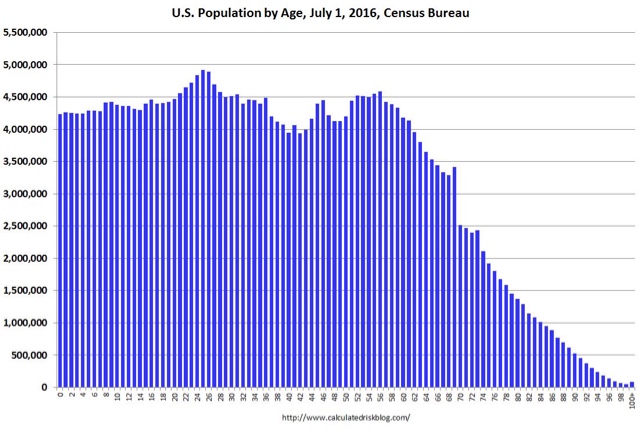
But wait, there’s more! Finally, let’s take into account the Grim Reaper. Here’s the Census Bureau’s year by year look at population cohorts dating from 2016 (h/t Calculated Risk):
There is a very consistent die-off in each birth-year’s population of about 100,000 per year beginning in their late 50s.
That means that in the last four years, roughly 3.2 million of the “red” 8 million Truman cohort and another 3.2 million of the “red” 12 million Eisenhower cohort who were alive in 2014 have passed away.
Put this all together and the basic fact is that the 2018 voting population is going to be considerably more liberal and Democratic than the 2014 population, even if Millennials turn out only in percentages consistent with younger voters in other midterm elections.
—–
The sour implication is very clear: Obama broke their hearts. After promising “Hope and Change,” aside from healthcare (not their core issue!) he mainly delivered a nip and tuck around the edges of the neoliberal consensus.
In order for Millennials to turn their ideological choices into reality, they are going to have to take a few centrist Democratic scalps.

