The simple Fed funds + payrolls leading indicator: autumn update While we are waiting for tomorrow’s jobs report, let me update my alternative Fed funds + payrolls leading indicator for the economy, which I debuted earlier this year. This was the result of looking for an interest rate indicator that did not rely upon the yield curve. This indicator is really simple, and what it predicts is, if the Fed fate rises YoY by as much as the YoY% change in jobs growth, the economy will fall into recession within roughly a year. Here is the long term history of this indicator: It’s been infallible since the 1960s. Well, the Fed raised rates by 0.25% last week, so let’s zoom in on where we stand now: The YoY change in the Fed funds rate is +1.0%, while the
Topics:
NewDealdemocrat considers the following as important: Taxes/regulation, US/Global Economics
This could be interesting, too:
Joel Eissenberg writes How Tesla makes money
Angry Bear writes True pricing: effects on competition
Angry Bear writes The paradox of economic competition
Angry Bear writes USMAC Exempts Certain Items Coming out of Mexico and Canada
The simple Fed funds + payrolls leading indicator: autumn update
While we are waiting for tomorrow’s jobs report, let me update my alternative Fed funds + payrolls leading indicator for the economy, which I debuted earlier this year. This was the result of looking for an interest rate indicator that did not rely upon the yield curve. This indicator is really simple, and what it predicts is, if the Fed fate rises YoY by as much as the YoY% change in jobs growth, the economy will fall into recession within roughly a year.
Here is the long term history of this indicator:

It’s been infallible since the 1960s.
Well, the Fed raised rates by 0.25% last week, so let’s zoom in on where we stand now:

The YoY change in the Fed funds rate is +1.0%, while the YoY% change in payrolls, through August, was +1.6%. No recession is signaled by this model for the next 12 months.
But wait, there’s more! Because the change in the Fed funds rate seems to have a predictable relationship to the YoY% growth in jobs over the next 12-18 months, let’s take a look at that.
In the next set of graphs, the YoY change in the Fed funds rate is inverted, i.e., a +1% change in the Fed funds rate YoY shows as -1. Then we take the YoY% growth in jobs from the first set of graphs above, and measure the YoY change in that (i.e., the YoY change in the YoY% growth). Again, here’s the long term look:

A 1% increase in the Fed funds rate has historically strongly correlated with roughly a 1% decline in the YoY *rate* of job growth. In fact, 12 out of the 15 times since the late 1950s that the Fed funds rate has risen by 1% or more YoY, the YoY rate of job growth has declined. In the remaining 3 times, it declined no later than 19 months out.
So now let’s zoom in on the last 5 years:
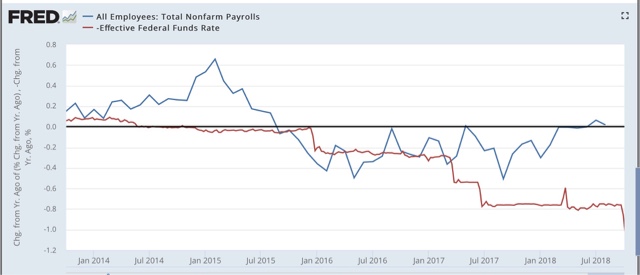
The YoY rate of job growth went up more than expected in 2014, and hasn’t declined at all in the last year. The last year is probably explained by (1) anomalous increased spending for repairing hurricane damage last autumn, and (2) the fiscal stimulus passed by Congress last December [Note: it may be a very inequitable and inefficient stimulus, but it was still a stimulus]. The model cannot be expected to account for either of these.
All of which means, left to its own devices, the YoY effect of the stimulus is going to end by roughly next February. And although Hurricane Frances was bad, it wasn’t nearly so bad as the trifecta of bad hurricanes one year ago. Which means I expect the relationship to re-assert itself by early next year: monthly job reports should average less than +1.6% YoY, or less than +200,000 per month, and most likely closer to +0.6% YoY (the current +1.6% minus 1%), or about +75,000 per month, by the end of next summer.
In short, this is yet another long term indicator strongly suggesting a significant summer slowdown next year.