Tuesday , November 5 2024
Home / The Angry Bear / Fraying at the edges? *relative* underemployment increases

Fraying at the edges? *relative* underemployment increases

Summary:
This is a post I’ve been meaning to put up all week (after all, this week was going to be very slow on data and news, right?). As the expansion gets more and more mature, the *relative* performance of certain measures of improvement become more interesting.  One of those is the comparison between U3 unemployment, and the broader U6 underemployment measure. While we only have about 25 years of data, so caution is warranted, generally speaking, during that time as the expansion has improved, an increasing number of the more marginally employable find jobs. As a result, U6 declines faster than U3. Later on, as the expansion begins to wane, U6 underemployment has weakened first: Another way of looking at this is to subtract the U3 unemployment

Topics:
NewDealdemocrat considers the following as important: ,

This could be interesting, too:

Joel Eissenberg writes Elon Musk can’t do arithmetic

Bill Haskell writes Opinion Piece “China’s One-Child Economic Disaster”

Joel Eissenberg writes A housing crisis? Location, location, location

Angry Bear writes What Happens When Corporate Places Greater Emphasis on Stock Buybacks Rather than Quality?

This is a post I’ve been meaning to put up all week (after all, this week was going to be very slow on data and news, right?).
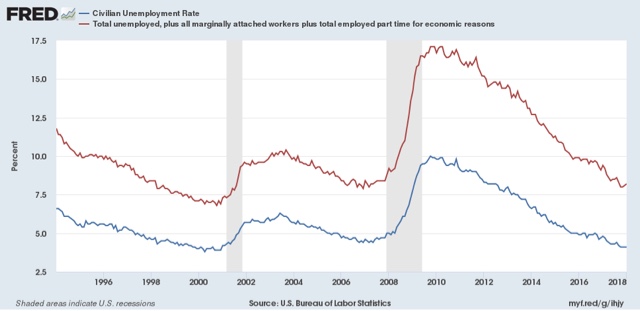
As the expansion gets more and more mature, the *relative* performance of certain measures of improvement become more interesting.  One of those is the comparison between U3 unemployment, and the broader U6 underemployment measure.
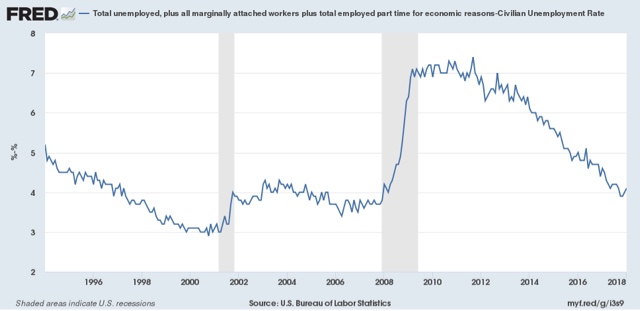
While we only have about 25 years of data, so caution is warranted, generally speaking, during that time as the expansion has improved, an increasing number of the more marginally employable find jobs. As a result, U6 declines faster than U3. Later on, as the expansion begins to wane, U6 underemployment has weakened first:
Fraying at the edges? *relative* underemployment increases
Another way of looking at this is to subtract the U3 unemployment figure from that of the broader U6 measure:

Fraying at the edges? *relative* underemployment increases
Note that in both the 1990s and 2000s, this remainder started to rise before U3 itself bottomed.
More important for the present, note that this remainder of U6-U3 has risen slightly in the last 2 months, as the unemployment rate has held steady and the underemployment rate has risen by 0.2%.
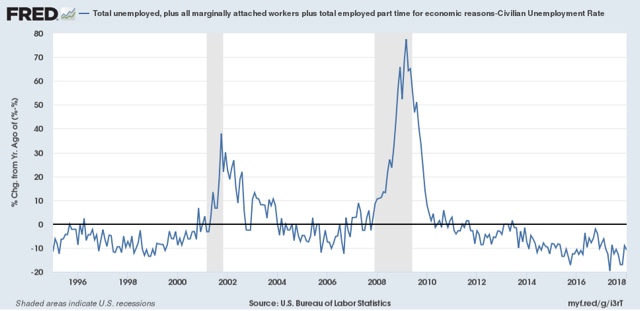
Yet another way to look at this is to chart the YoY change in this remainder:
Fraying at the edges? *relative* underemployment increases
Note the slight weakening in this metric as well.
It might just be noise, but on the other hand it could be an early sign of weakness starting in the job market. If so, that doesn’t mean a recession is near, as in the next 3 to 6 months. But it bears continued watching.

Once more into a the market abyss

 – by New Deal democrat
So the stock market is down 10% as of this writing, which takes us all the way back to — three months ago!
Really? This is what you’re worried about?
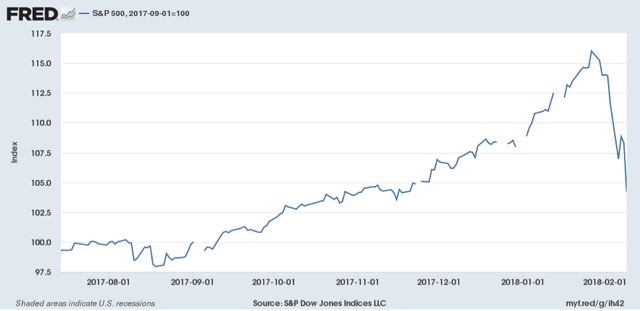
A little context. Here’s a graph of the S&P 500, normed to 100 as of September 1, 2017:
Fraying at the edges? *relative* underemployment increases
The market went up 16% in 5 months, or +.75% each and every week.  That translates into an annual rate of +48%!  A 48% annual gain coming out of a recession isn’t a big deal. Coming 9 years into a bull market, that, dear reader, is a blowoff.
Even if you figure that corporate profits were going to be up 5% YoY this year, and even if you figure that the recent tax cut for corporations was going to add 10% to that — well, the market added all of that in already, didn’t it?
And now that froth has been poured off.
To reiterate, the vast majority of other leading indicators, both long and short, are inconsistent with a recession starting in the next 3 to six months. Just this week, the Senior Loan Officer Survey, the JOLTS report, and initial jobless claims all pointed to continued expansion. As did last week’s ISM manufacturing new orders numbers, as do the regional Fed reports, as do mortgage applications, as do the recent monthly housing reports.
If the vast majority of data says we’re not heading into recession, then it is very, very unlikely that this correction is going to turn into something long-lasting.
In the last few days, I’ve gotten pushback that good leading indicators are bad, because they must be close in time to a bottom. Nonsense!
Let me introduce you to Lee Adler at the Wall Street Examiner, who wrote:

Record low claims are the patina of policy success ….  These record claims represent a bubble that was born out of and is joined at the hip with the financial engineering bubble that has been metastasizing in the US economy for a generation.

Just one problem: this quote comes from November 2015, when initial jobless claims were averaging 270,000 per week.

See the problem?

In my opinion, If you are middle or working class, and you have some money in the market via a 401k or similar, and you can’t stand a 10% downturn, then you shouldn’t be in the market at all, but rather devote that money to a cash-type of portfolio that allows you to sleep at night and not worry about your future.  One rule of thumb I set for myself way back 25 years ago when I first got interested in this stuff, is what I called “the Turtle Method,” as in turtle vs. hare. That rule of thumb was that, for every month’s expenses I had saved, I could invest 1% of my assets. So if I had 10 months of savings, I could invest 10% of my total assets.  That way I could sleep at night.

Bottom line: there are a lot of major problems in this country right now. How the economy is doing isn’t one of them, and that is very unlikely to change in the next 3-6 months.

Leave a Reply

Your email address will not be published. Required fields are marked *