Setting markers for a 2019 slowdown in the jobs market How might a slowdown (not a recession, but a decline in growth to the 1%-2% YoY range in GDP) that I’ve been forecasting for around midyear 2019 manifest itself in the employment arena? One of my mantras is that “hiring leads firing.” In other words, companies slow or stop their hiring plans, or cut back on hours, before they actually start laying people off. So, one natural place to look is the “hires” component of the Job Openings and Labor Turnover (JOLTS) survey. Here’s what the *rate* of hiring looks like over the nearly 20 year life of that survey: If there is a slowdown, I would expect this rate to plateau, in the 3.7%-3.9% range, similar to its plateauing in 2015-16, when we had the
Topics:
NewDealdemocrat considers the following as important: US/Global Economics
This could be interesting, too:
Joel Eissenberg writes How Tesla makes money
Angry Bear writes True pricing: effects on competition
Angry Bear writes The paradox of economic competition
Angry Bear writes USMAC Exempts Certain Items Coming out of Mexico and Canada
Setting markers for a 2019 slowdown in the jobs market
One of my mantras is that “hiring leads firing.” In other words, companies slow or stop their hiring plans, or cut back on hours, before they actually start laying people off.
So, one natural place to look is the “hires” component of the Job Openings and Labor Turnover (JOLTS) survey. Here’s what the *rate* of hiring looks like over the nearly 20 year life of that survey:
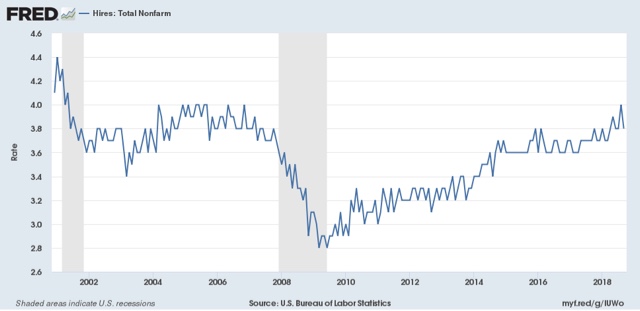
If there is a slowdown, I would expect this rate to plateau, in the 3.7%-3.9% range, similar to its plateauing in 2015-16, when we had the “shallow industrial recession.” Obviously there’s not enough there to make a call at this point, but this is a data point I’ll be watching.
On the “firing” front, the easiest place to look is the weekly initial jobless claims report, particularly in the less volatile 4 week moving average. Here’s what that looks like over the past 5 years:

Again, note that from roughly spring 2015 through spring 2016, the decline in weekly jobless claims almost stalled out. Here’s what the same data looks like measured as a YoY% change:

During the “shallow industrial recession,” the YoY% decline in new jobless claims rose from roughly -10% to -5%, with a fair amount of noise. I would be looking for a similar move over the next 8 months, to the range of -5% or even flat YoY. [Note: the spike upward in late 2016 was due to the hurricanes, leading to a similar spike downward one year later.]
On a weekly basis, this means I am looking for initial jobless claims to stay above 200,000, except for an occasional weekly outlier, and for the 4 week average, which at midyear this year was in the 220-225,000 range, to be in the range of 207,500 to 220,000 at midyear 2019.
Needless to say, I am also looking for monthly employment gains to decline back significantly below 200,000 by that time.