This is a post aimed at the generally Progressive audience of this blog who followed us over from way back in our days at Daily Kos, rather than the financially sophisticated audience who have picked us up since (but of course everybody is welcome to read and appreciate!).
Anyway, at times like this over 10 years ago Bonddad used to write posts like “A comment about the markets” for the DK audience, explaining the “significance” of the market action. So in that tradition ….
First of all, don’t base any investing decision on advice from anyone you read online — including me. If you are concerned enough, go talk to a registered financial professional. In particular, at times like this, the Doomers are going to come out of the woodwork, especially at places like Daily Kos. It got to the point that in years past, I used to use the “Pied Piper of Doom” at DK
as a contrary indicator. I once even called the bottom of a market selloff similar to the present one
*in real time* based on his panicky post.
That being said. here’s my take based on over 25 years of watching the markets closely, and seeing this kind of selloff maybe 20 times. Moves of 3% or more a day are based on emotion, either euphoria (less likely) or panic (more likely!), or more recently, “algorithms gone wild!” (think of the “flash crash.” That is a very bad basis on which to make a decision about your money.
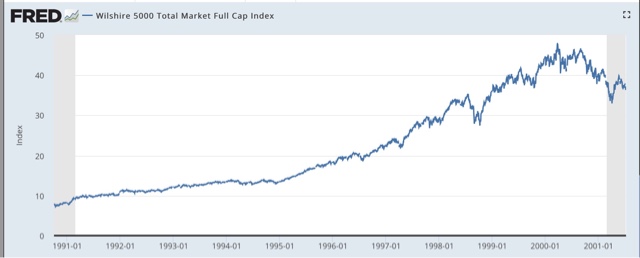
Because I am a nerd, and I always show you graphs, here’s a three-pack to put this in perspective. First, here is the entire 1990s, the second half of the biggest bull market in history:
Looks like a pretty relentless move up, doesn’t it?
Well, about once a year, some sort of panic would set in. There would be about a 10% selloff, including some panicky days like yesterday, Doomish analysts would come out in droves on CNBC, and at about the 10% mark, a famous maven like Elaine Gharzarelli, would had correctly foretold the 1987 crash, would come on and say something like that her “crash warning” for a 25% drop had been activated. And at almost exactly that moment, the markets would bottom.
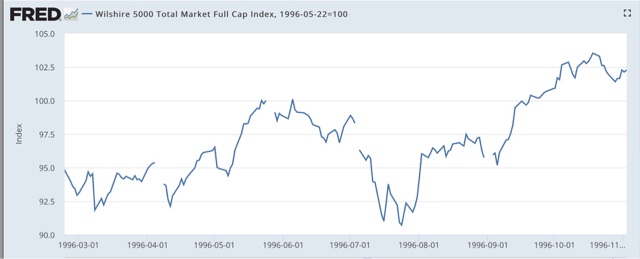
Here, for example, is 1996:
Usually the bottom would actually be at about -9.8% or -9.9%. Why? Because big players would have programs set to buy at 10% off. To be sure to get in, other big players would get in front of the move just before the 10% level — and so it would never actually arrive.
These annual -10% spikes were typically heralded by some change in the market “story,” on the order of an increase in inflation or fears of renewed Fed tightening. But they didn’t fundamentally alter the economy, and so the 10% was recovered typically within a few months, as it was in 1996.
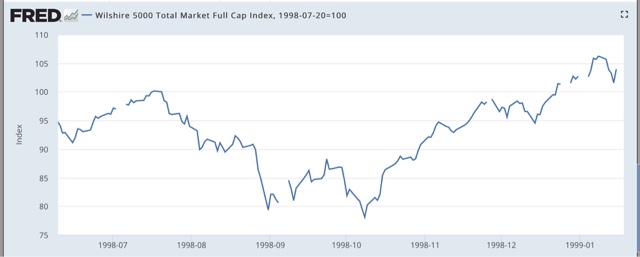
The worst such move happened in 1998 during the Asian Currency Crisis, when an early hedge fund called “Long Term Capital Management” went bust. The former was a significant concern, because southeast Asian economies looked set to roll over. The latter sparked fears of a wider financial meltdown. Here’s what that downturn looked like:
The Fed stepped in, arranging for the debt to be mopped up, and it was off to the final blowoff top!
The common thread here is, that in almost all cases, these selloffs in retrospect look like V-shaped spikes, as the fundamental underlying economy reasserts itself.
The exceptions, obviously, were 1929 and 2008, where the underlying economy was really fragile, and subject to a debt-deflation vicious cycle.
As I wrote as recently as last week, the “long leading indicators” for the economy do not forecast any fundamental downturn this year. Interest rates haven’t spiked that much, housing data just made new highs within the last several months, and credit is still ample. The stock market, by contrast, is a “short leading indicator,” forecasting only a few months ahead. Why should I expect a short leading indicator to lead the long leading indicators?
So my best guess is that we will see a climax in panic — maybe at 9:35 this morning! — with roughly a 10% decline, and then nervous bouncing along that bottom for the next several weeks.
If you are an average worker, and don’t own stocks (including in your 401k), you should do what you should always be doing: observing how things are going at your employer. Has there been a weakening of orders or customers? If yes, prepare for possible layoffs. If no, there’s no reason to think this market downturn is going to change that.
Even if you do have securities in, e.g., your 401k, how did you feel about stocks a few months back when they were at this level? Were you satisfied? If so, why should you feel differently now? Some of the worst financial moves I have witnessed were people who sold in the panic of 2008, and never bought back. But if you are losing sleep now, imagine how you will feel in the face of a genuine 25% pullback, say, in the next recession. That means you should go turn to a financial professional and have a plan that you can sleep with.
In short: don’t get emotional about this selloff. Give it the ol’ fish-eye. Make and stick with a long-term plan.
And, to repeat, don’t make financial moves based on what you read from some dude or gal online, and that includes me. I am not a certified financial planner, and I am not trying to give you financial advice to buy or sell.
—P.S. One thing which could cause more turmoil within a few days is if there is another government hutdown, and it lasts a lot longer than the last one. All the signs are that the GOP in the House intends to continue to pass “shrot term” fixes, with long term goodies that they want, and blackmail the D’s with the release of one hostage at a time (and I don’t think the Dremeres are ever going to be released). So far the marekts are downplaying any big fallout.


