October housing permits and starts flat vs. trend This morning’s report on housing permits and starts will do nothing to stop the now-received wisdom that higher interest rates, higher prices, (and the impact of the cap on the mortgage tax deduction) has caused this most important cyclical market to cool. On the other hand, they aren’t evidence of any intensifying downturn. While we wait for FRED, here’s the Census Bureau’s graphic representation of permits, starts, and completions: Here are the basic important numbers: single family permits down -0.6% m/m -0.6% YoY total permits -0.5% m/m -6.0% YoY total starts -+1.5% m/m -2.9% YoY 3 month average of total starts +1.0% m/m +3.2% YoY As usual, let’s start with single family permits, which are the
Topics:
NewDealdemocrat considers the following as important: US/Global Economics
This could be interesting, too:
Joel Eissenberg writes How Tesla makes money
Angry Bear writes True pricing: effects on competition
Angry Bear writes The paradox of economic competition
Angry Bear writes USMAC Exempts Certain Items Coming out of Mexico and Canada
October housing permits and starts flat vs. trend
This morning’s report on housing permits and starts will do nothing to stop the now-received wisdom that higher interest rates, higher prices, (and the impact of the cap on the mortgage tax deduction) has caused this most important cyclical market to cool. On the other hand, they aren’t evidence of any intensifying downturn.
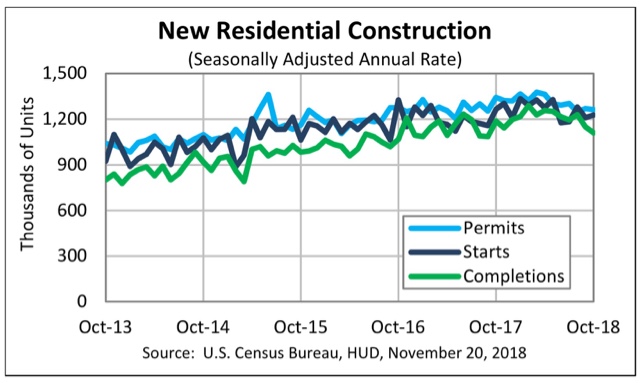
While we wait for FRED, here’s the Census Bureau’s graphic representation of permits, starts, and completions:
Here are the basic important numbers:
- single family permits down -0.6% m/m -0.6% YoY
- total permits -0.5% m/m -6.0% YoY
- total starts -+1.5% m/m -2.9% YoY
- 3 month average of total starts +1.0% m/m +3.2% YoY
As usual, let’s start with single family permits, which are the least volatile of all the leading housing indicators. These last made a new high 8 months ago, and for the first time since April 2014 they are down YoY. Before that, the last time they were down YoY was in 2011 after the expiration of the stimulus tax credit. They are also down about -4.1% from their peak. While negative, this is not a decline that is consistent with a recession.
Total permits are off -7.6% from their peak, in March .This isn’t recession watch territory either.
The 3 month average of housing starts smooths out this much more volatile series. They are down -6.1% from their March peak. The single month peak, due to revisions, is now back in January.
Two months ago I wrote that the poor data had gone on long enough and was deep enough enough to turn this important long leading indicator negative. In the last two months, more data series, such as purchase mortgage applications, have also turned down. This remains true, but the *relatively* good news is that both single family permits and the three month average of housing starts have improved from their August lows of 827k and 1214k, respectively. In other words, there’s been a decline from peak, but the trend – for now – is sideways since then.
Since interest rates have risen further in the last several months, I do not expect housing to improve over the next 3-6 months. To the contrary, it will probably worsen at least slightly. In short, this morning’s data only reinforces my call that, absent a change of course by the Fed, housing has peaked for this cycle.

