Could an Oil Patch decline turn a 2019 slowdown into an outright recession? One of the items I mentioned in my piece yesterday at Seeking Alpha was the recent big decline in oil prices. Please go read the piece, it puts a couple of pennies in my pocket! But in that article I referenced the decline in industrial production that was caused by the 2014-15 decline in gas prices. I wanted to follow up a little here. In 2014 into early 2015, Oil prices declined by almost 75%, from a little under 0/barrel to a little under /barrel. Gas prices declined from close to /gallon to about .75/gallon: The recent decline in oil and gas prices, while significant, is less than half of that. Energy extraction is counted in the “mining” component of
Topics:
NewDealdemocrat considers the following as important: US/Global Economics
This could be interesting, too:
Joel Eissenberg writes How Tesla makes money
Angry Bear writes True pricing: effects on competition
Angry Bear writes The paradox of economic competition
Angry Bear writes USMAC Exempts Certain Items Coming out of Mexico and Canada
Could an Oil Patch decline turn a 2019 slowdown into an outright recession?
One of the items I mentioned in my piece yesterday at Seeking Alpha was the recent big decline in oil prices. Please go read the piece, it puts a couple of pennies in my pocket! But in that article I referenced the decline in industrial production that was caused by the 2014-15 decline in gas prices. I wanted to follow up a little here.
In 2014 into early 2015, Oil prices declined by almost 75%, from a little under $110/barrel to a little under $30/barrel. Gas prices declined from close to $4/gallon to about $1.75/gallon:
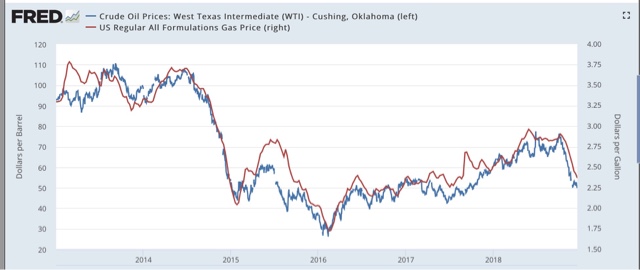
The recent decline in oil and gas prices, while significant, is less than half of that.
Energy extraction is counted in the “mining” component of industrial production, but even the “manufacturing” component declined between the end of 2014 and mid-2016:
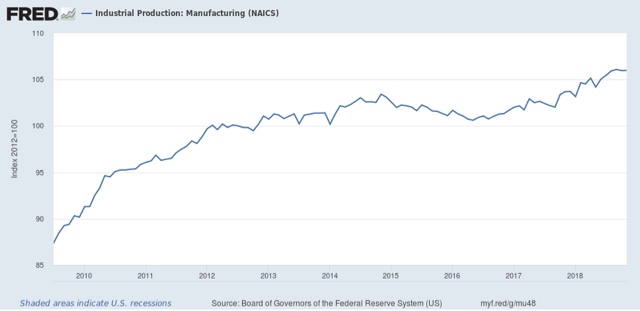
At the time I called it the “shallow industrial recession.” While GDP never turned outright negative, real GDP slowed to 1% annualized in Q3 2016 and 0.4% in Q4 of that year. That’s a real slowdown!
So, why wasn’t there an actual recession? Because employment, sales, and income continued to rise. As I and almost everybody else said at the time, the big decline in gas prices was a boon to consumers. And indeed it was, as shown in the below graph of real personal income (red) and real personal spending (blue)(note: in the graph both series are normed to 100 as of the bottom of the recession in 2009):
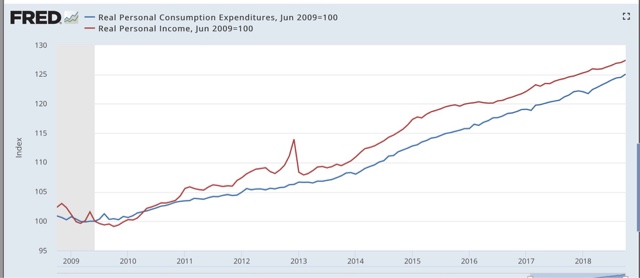
In fact, as you can see in the graph, both series not only rose, but, especially for spending, both rose a little more steeply in 2016. In other words, the decline in gas prices, which showed up as a decline in inflation, put more “real” money in consumers’ pockets, and they spent it, and then some. (Note: the graph does not include this morning’s +0.1% increase in real personal income and +0.3% increase in real personal spending for November),
This shows up in the next graph, which is the personal saving rate:

Preliminarily, note that in 2012 there was a 2% FICA tax rebate, which shows up as an increase in the savings rate, which then reversed in January 2013. But notice that consumers kept savings constant in 2015, and then dug into their pockets and spent a little more vs. saving in early 2016. (Note: graph does not show this morning’s small decline in the savings rate).
While I claim no expertise whatsoever it what will happen to the price of gas and oil from here, what I can say is that, if prices remain low or continue lower, a smaller version of the 2015-16 pattern in both production and consumption is a good simple model. That in turn suggests that there would be pain in the Oil Patch, flatness in manufacturing production, and a mild increase in income and consumption.
The problem, of course, is that these consequences are piled on top of the slowdown that has already been strongly suggested by the flatness in the long leading indicators for the past 7 months, and the haphazard and generally negative effects of Trump’s trade wars that were initiated since then.
In other words, the effects of a knock to “Saudi America” together with the effects of the trade wars, might be enough to turn a slowdown next summer that already looks “baked in the cake” into a recession. I’m not changing my opinion yet, but the argument is powerful, and I’m chewing it over.