Real median household income rose 1.8% in 2017; poeverty rate declined The Census Bureau reported Sept. 12 that *real* median household earnings rose 1.8% in 2017. Here’s their presentation graph: This is another score by Sentier Research, whose monthly estimates have accurately forecast the Census Bureau’s (very tardy) annual reports and showed, on an annualized basis, growth in 2017, but on an averaged basis less than that from 2014 to 2015, or 2015 to 2016: Remember a couple of caveats: – “households” includes *all* households, including, e.g., year-round college roommates and, especially, retirees. Retirees’ income is typically only about 1/2 of that of workers, so hoardes of retiring Boomers are affecting the median. – “income” is
Topics:
NewDealdemocrat considers the following as important: US/Global Economics
This could be interesting, too:
Joel Eissenberg writes How Tesla makes money
Angry Bear writes True pricing: effects on competition
Angry Bear writes The paradox of economic competition
Angry Bear writes USMAC Exempts Certain Items Coming out of Mexico and Canada
Real median household income rose 1.8% in 2017; poeverty rate declined
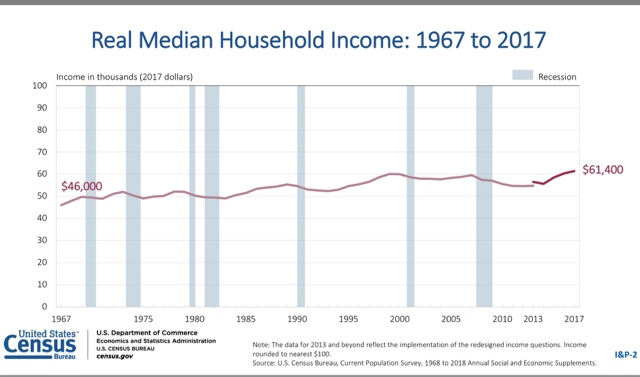
The Census Bureau reported Sept. 12 that *real* median household earnings rose 1.8% in 2017. Here’s their presentation graph:
This is another score by Sentier Research, whose monthly estimates have accurately forecast the Census Bureau’s (very tardy) annual reports and showed, on an annualized basis, growth in 2017, but on an averaged basis less than that from 2014 to 2015, or 2015 to 2016:

Remember a couple of caveats:
– “households” includes *all* households, including, e.g., year-round college roommates and, especially, retirees. Retirees’ income is typically only about 1/2 of that of workers, so hoardes of retiring Boomers are affecting the median.
– “income” is more inclusive than “wages.” For example, stock dividends interest on bonds are forms of income.
That being said, real income from full-time employment actually *declined* in 2017:

The difference between the rise in “all workers'” incomes on the left, and that of full-time employees on the right, is the increase in the number of hours worked by part-time workers, including transitioning to full-time employment. Recall that involuntary part-time employment has been declining sharply over the last 18 months:

The poverty rate did decline, so that is a definite plus:

What I still haven’t found, and will update when I do, is real median household income by age cohort (that will take care of the issue of the increasing percentage of retiree households).