An update on yield curve dynamics So I submitted this wonderful piece to Seeking Alpha Tuesday morning, and figured I would just link to it today. But as in the best laid plans of mice and men, somehow it reverted to a draft without ever being reviewed by the site’s editors, which means it isn’t up there yet and there is no big economic news today. Sigh. So in the meantime, consider this …. The bond market is behaving in totally typical fashion in response to the Fed raising interest rates. Typically the yield curve doesn’t invert because long duration yields come down to short duration yields. Rather, *all* durations of yields rise. It’s just that shorter duration yields rise faster, and ultimately overtake longer duration yields. Here’s the
Topics:
NewDealdemocrat considers the following as important: Taxes/regulation, US/Global Economics
This could be interesting, too:
Joel Eissenberg writes How Tesla makes money
Angry Bear writes True pricing: effects on competition
Angry Bear writes The paradox of economic competition
Angry Bear writes USMAC Exempts Certain Items Coming out of Mexico and Canada
An update on yield curve dynamics
So I submitted this wonderful piece to Seeking Alpha Tuesday morning, and figured I would just link to it today. But as in the best laid plans of mice and men, somehow it reverted to a draft without ever being reviewed by the site’s editors, which means it isn’t up there yet and there is no big economic news today.
Sigh. So in the meantime, consider this ….
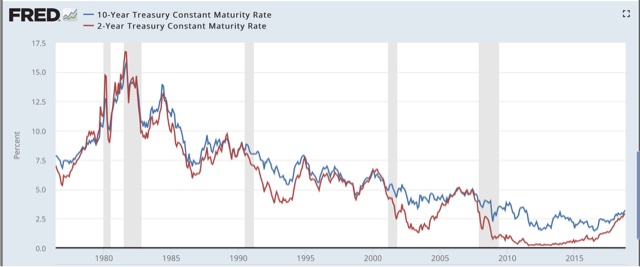
The bond market is behaving in totally typical fashion in response to the Fed raising interest rates. Typically the yield curve doesn’t invert because long duration yields come down to short duration yields. Rather, *all* durations of yields rise. It’s just that shorter duration yields rise faster, and ultimately overtake longer duration yields. Here’s the relevant graph for the past 40 years
If we think of interest rates as “the cost of renting money,” then the economy slows because that cost increases across all time frames, and enough producers and consumers decide to put off “renting money” in order to purchase things that the economy slows down or goes into reverse.
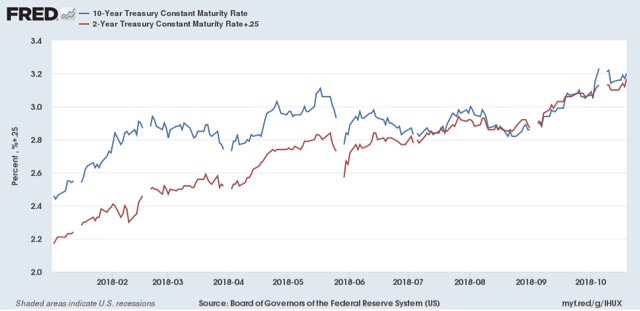
Now here is a close-up on the same information since the beginning of this year. I’ve added +0.25% to the 2 year bond (red line) since my cutoff line for where I rate the yield curve as “neutral” is when the 2 year yield is within 0.25% of the 10 year yield:
In the above graph, we see that (a) both lines are rising, and (b) the red line overtook the blue line beginning in August. It took long rates rising to new 7 year highs above 3.10% to interrupt that dynamic. But if you look to the far right, you can see that in the past couple of days the lines are converging again. As of this morning the 2 year yield is only 0.27% less than the 10 year yield, even with the 10 year yield at 3.15%.
If the recent trend continues, we will probably see an inversion in the 2 to 10 year yield spread by St. Patrick’s Day next March. I already see enough signs out there to have forecast a slowdown in the economy by roughly midyear next year. If I’m correct, the outstanding question will be whether the Fed reacts by lowering interest rates again quickly, or else stubbornly sticks to its “normalization” rubric and thereby brings about a recession. This in turn may depend upon whether producer price inflation rises again and leaks over into consumer prices.


