Summary:
The yield curve is already signaling a slowdown Throughout this expansion, I have had a sneaking suspicion that the yield curve (the difference in interest rates between short and long term bonds) would be the indicator most likely to fail. Originally that was because we are in a very non-inflationary period similar to that which prevailed between the 1920s and 1950s. After 1929, at no time during the 1930s, 1940s, or early 1950s did the yield curve invert, even though there were five recessions during that time, including the very deep 1938 recession. Now I have a second concern: too many people are paying too much attention to it. As a result, they are “anticipating” an inversion and may be altering their behavior in response, in a way they have not
Topics:
NewDealdemocrat considers the following as important: Taxes/regulation, US/Global Economics
This could be interesting, too:
Joel Eissenberg writes How Tesla makes money
Angry Bear writes True pricing: effects on competition
Angry Bear writes The paradox of economic competition
Angry Bear writes USMAC Exempts Certain Items Coming out of Mexico and Canada
The yield curve is already signaling a slowdown
Throughout this expansion, I have had a sneaking suspicion that the yield curve (the difference in interest rates between short and long term bonds) would be the indicator most likely to fail.
Originally that was because we are in a very non-inflationary period similar to that which prevailed between the 1920s and 1950s. After 1929, at no time during the 1930s, 1940s, or early 1950s did the yield curve invert, even though there were five recessions during that time, including the very deep 1938 recession.
Now I have a second concern: too many people are paying too much attention to it. As a result, they are “anticipating” an inversion and may be altering their behavior in response, in a way they have not done in the past. Humans are very sneaky primates, and when you observe their behavior, they always observe back.
That being said, it would also be a mistake to ignore such a trustworthy signal in the past. So, as usual, I K.I.S.S. and consider it among the array.
And in that vein, as I write this the spread between 2 and 10 year bonds is down to +.32%. That is narrow enough that, if past is prologue, a signal is being sent.
Here is the graph showing this spread for the last 40 years (blue), wherein I have subtracted -.35% so that the current spread is at the “zero” line, compared with real YoY GDP growth (red):
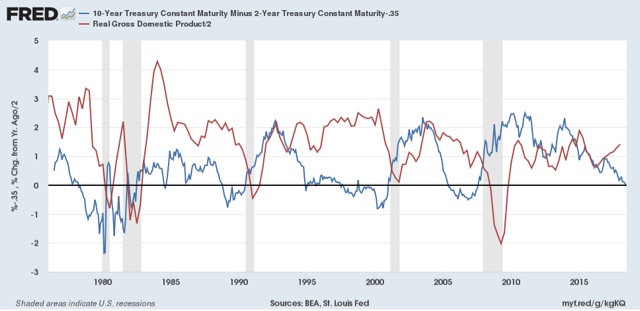
Needless to say, the spread crossed this line every time on the way to an inversion, which signaled a recession to come.
But on three other occasions — 1984, 1986, and 1994, the spread got to +.35% or lower without actually inverting. On those occasions there was no recession.
But there was a slowdown about 1 year later in each instance. YoY GDP growth *decelerated* by 5% from 1983 to 1984; by 1.5% from 1986 to 1987; and by 2% from 1994 to 1995.
So it’s a fair bet that there will be a similar deceleration of GDP growth from this quarter at some point in the next 12 months or so, even if there is no yield curve inversion.