We are probably close (~500,000) to “full employment” From time to time over the past few years I have tried to estimate how far we were from “full employment,” by which I meant the average levels of the best year in each of the past two expansions. I also estimated how long it would take to get there given the then-current monthly gains in employment. For example, two years ago I estimated that we needed to add another 2.5 million people, or 1.5% of the labor force, to the employment rolls in order to be at “full employment.” Last August, I updated the figure to a shortfall of about 0.8%, and estimated that, if employment trends held, we would get to “full employment” in about 9 to 12 months from then, which would be sometime between now and the end of
Topics:
NewDealdemocrat considers the following as important: US/Global Economics
This could be interesting, too:
Joel Eissenberg writes How Tesla makes money
Angry Bear writes True pricing: effects on competition
Angry Bear writes The paradox of economic competition
Angry Bear writes USMAC Exempts Certain Items Coming out of Mexico and Canada
We are probably close (~500,000) to “full employment”
From time to time over the past few years I have tried to estimate how far we were from “full employment,” by which I meant the average levels of the best year in each of the past two expansions. I also estimated how long it would take to get there given the then-current monthly gains in employment.
For example, two years ago I estimated that we needed to add another 2.5 million people, or 1.5% of the labor force, to the employment rolls in order to be at “full employment.” Last August, I updated the figure to a shortfall of about 0.8%, and estimated that, if employment trends held, we would get to “full employment” in about 9 to 12 months from then, which would be sometime between now and the end of summer.
Given the continuing very good jobs reports, I thought I’d take another look.
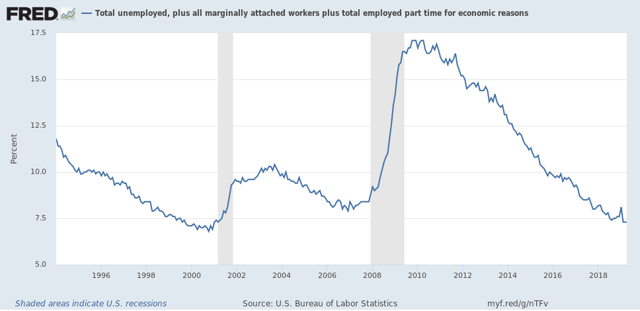
First, here is the U6 underemployment rate. This includes, most importantly, involuntary part-time workers. For us to be at full employment, this figure ought to be at its 1999-2000 and 2006-07 levels:

We have already surpassed the latter, and are only about 0.2% away from the former.
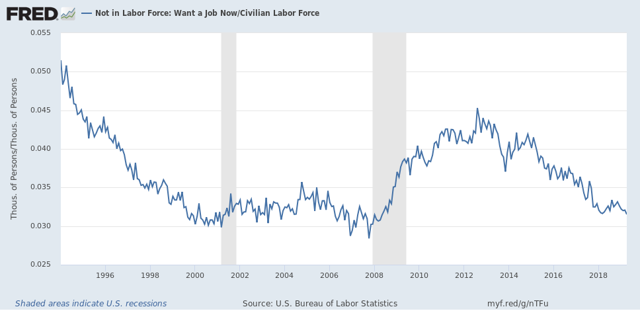
On top of that, there are also people who aren’t even in the labor force, because they haven’t looked for work, but tell the Census Bureau that they do want a job now. In the below graph, I’ve divided that by the civilian labor force to tell us what percentage over and above the labor force fit in that category:

Currently these are equivalent to a little under 3.2% of the total labor force. At its best average levels in the last two expansions, this number was 3.0%, in other words, we are also about 0.2% away.
Put these two together and they add up to between 0.2% and 0.4% of the 170 million labor force, or in other words 340,000 to 680,000. If monthly employment gains continue to run about 100,000 over the number needed just to accommodate an increasing prime age population, that puts us about 7 months away. Meaning we should reach “full employment” by the end of this year.
This, by the way, has implications for wages, because the closer we approach to “full employment,” the more employers will have to raise wages to entice people who aren’t currently in the labor force to decide to enter it.
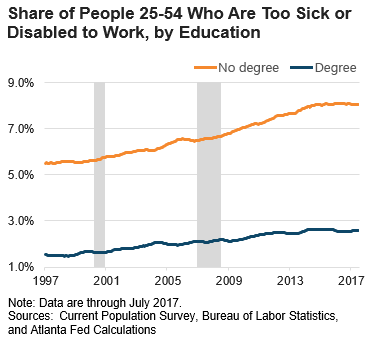
P.S. Yes I know it is more complicated than that. In particular people seem to come off disability rolls and find employment if it is plentiful enough at decent pay:

But at least some of that is probably reflected in the continuing elevated levels of underemployment and those who haven’t looked but have decided they now want a job. Also, I would expect that the prime age employment to population ratio will increase to over 80% as part of any further decrease in underemployment and job desirers who aren’t actively seeking employment.
