August new home sales continue rebounding trend Let me start out my look at this morning’s August new home sales report with my typical housing mantra: Interest rates lead sales Sales lead prices Prices lead inventory We saw all of that in this morning’s report. First, the trend of rising single family sales continues, and the three month average of this very volatile series (blue), shown in comparison with single family housing permits was the highest since late 2007: Note, by the way, that new single family home sales have a tendency to lead every other metric, including permits – but they are much more volatile and heavily revised. Next, the median new home price (red) turned positive YoY, for only the second time since the slump that began
Topics:
NewDealdemocrat considers the following as important: US/Global Economics
This could be interesting, too:
Joel Eissenberg writes How Tesla makes money
Angry Bear writes True pricing: effects on competition
Angry Bear writes The paradox of economic competition
Angry Bear writes USMAC Exempts Certain Items Coming out of Mexico and Canada
August new home sales continue rebounding trend
Let me start out my look at this morning’s August new home sales report with my typical housing mantra:
- Interest rates lead sales
- Sales lead prices
- Prices lead inventory
We saw all of that in this morning’s report.
First, the trend of rising single family sales continues, and the three month average of this very volatile series (blue), shown in comparison with single family housing permits was the highest since late 2007:
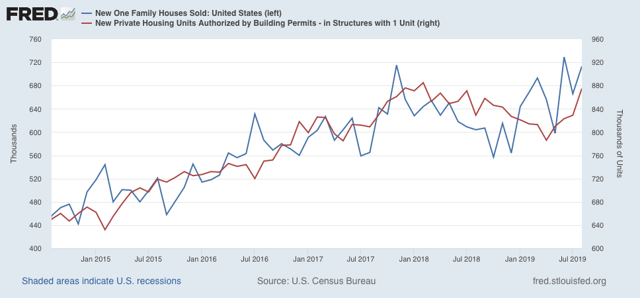
Note, by the way, that new single family home sales have a tendency to lead every other metric, including permits – but they are much more volatile and heavily revised.
Next, the median new home price (red) turned positive YoY, for only the second time since the slump that began last year, vs. the YoY change in sales (blue) which has been positive YoY for most of this year:
Finally, here is the long term view of new home sales vs. new homes for sale, I.e., inventory (gold):
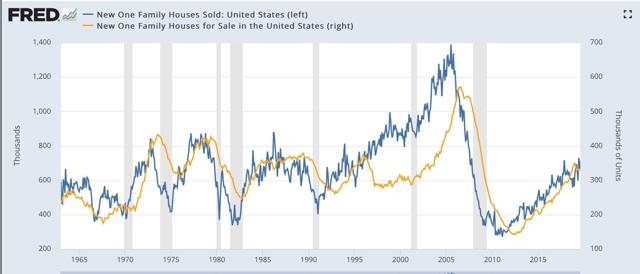
It’s easy to see that inventory only turns after sales do.
Now, here is the close up look of the past 5 years:
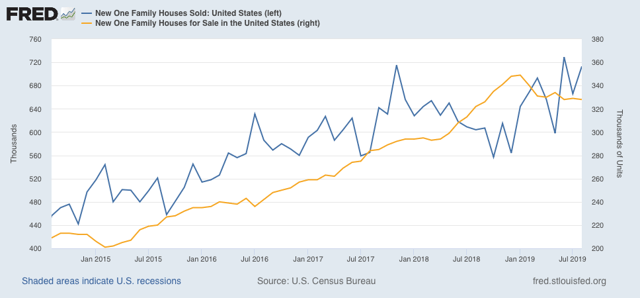
Inventory turned down earlier this year, and at the moment is stable at that lower level. Note that I do not make use of “month’s supply” of inventory in my analysis, because it is clear that it turns up or down only as a result of sales turning up or down.
In sum, August new home sales confirms that lower mortgage rates have caused sales to increase, prices appear to be beginning to follow, and inventory remains slightly reduce
As per my “housing choke collar” thesis, any quick continued increase in prices is likely to feed into a slowdown in sales.