With the presidential election still a year away, Wall Street is starting its normal analysis that if a democrat is elected it will cause a devastating stock market crash. One would think that after all these years of such claims being proven dead wrong that the street would finally give up on it. In the post WWII era from Truman to Obama it is 70 years and each party has had bad candidates in office for half that time. Truman was only President for seven years and five months so the Democrats only had 35.4 years in office while the Republicans had 36 years in office. Over these years the average annual S&P 500 gains was 15.9% for Democrats and 6.6% for Republicans. If you look at the actual returns, you would think if anything; Wall Street analyst
Topics:
Spencer England considers the following as important: Hot Topics, politics, US EConomics
This could be interesting, too:
Robert Skidelsky writes Lord Skidelsky to ask His Majesty’s Government what is their policy with regard to the Ukraine war following the new policy of the government of the United States of America.
NewDealdemocrat writes JOLTS revisions from Yesterday’s Report
Joel Eissenberg writes No Invading Allies Act
Ken Melvin writes A Developed Taste
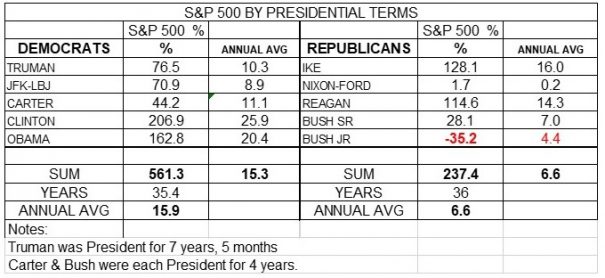
With the presidential election still a year away, Wall Street is starting its normal analysis that if a democrat is elected it will cause a devastating stock market crash. One would think that after all these years of such claims being proven dead wrong that the street would finally give up on it. In the post WWII era from Truman to Obama it is 70 years and each party has had bad candidates in office for half that time. Truman was only President for seven years and five months so the Democrats only had 35.4 years in office while the Republicans had 36 years in office. Over these years the average annual S&P 500 gains was 15.9% for Democrats and 6.6% for Republicans. If you look at the actual returns, you would think if anything; Wall Street analyst would be warning about the dangers of a Republican President for the stock market.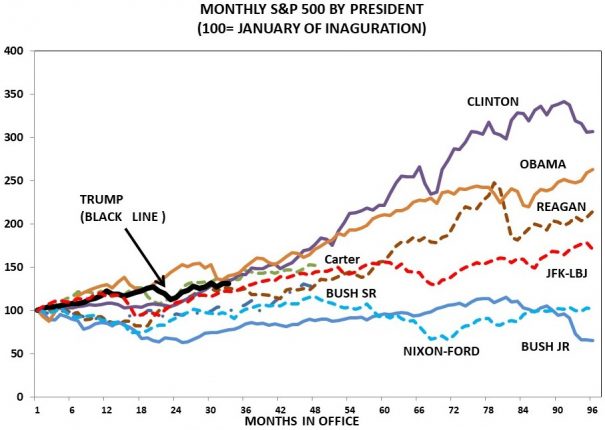
Because the chart is already so cluttered I left Truman and Ike off. But it seem so obvious that the record shows that it is Republican Presidents that investors should fear. Just to clearly show that stock market gains have been more that double under Democrats versus Republicans I’ve also presented the data in a table.