Scenes from the October employment report: full employment? Last Friday the household jobs report – the one that tells us about unemployment, underemployment, and labor force participation – has been particularly strong in the past three months. This has driven some impressive gains in labor force participation and the unemployment rate. To begin with, gains in employment as measured by the household survey (red in the graphs below), as opposed to the larger (and, yes, more reliable) payrolls survey (blue), have totaled 1,222,000 in the last three months: One month ago this gave us the lowest unemployment rate in the past 50 years, and the U6 underemployment rate is also at its lowest level, save for one month, since the series began in 1994. Each
Topics:
NewDealdemocrat considers the following as important: Taxes/regulation, US/Global Economics
This could be interesting, too:
Joel Eissenberg writes How Tesla makes money
Angry Bear writes True pricing: effects on competition
Angry Bear writes The paradox of economic competition
Angry Bear writes USMAC Exempts Certain Items Coming out of Mexico and Canada
Scenes from the October employment report: full employment?
Last Friday the household jobs report – the one that tells us about unemployment, underemployment, and labor force participation – has been particularly strong in the past three months. This has driven some impressive gains in labor force participation and the unemployment rate.
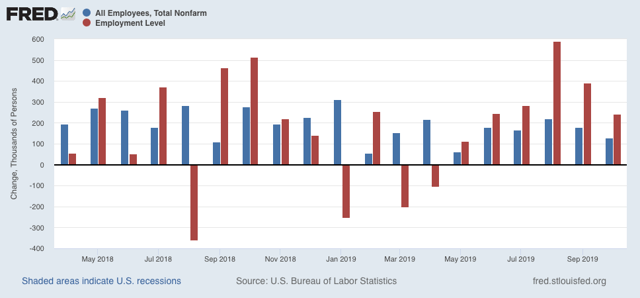
To begin with, gains in employment as measured by the household survey (red in the graphs below), as opposed to the larger (and, yes, more reliable) payrolls survey (blue), have totaled 1,222,000 in the last three months:
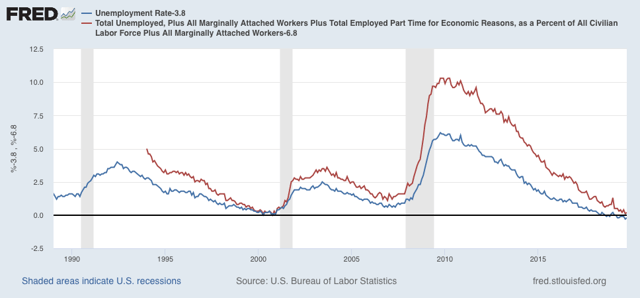
One month ago this gave us the lowest unemployment rate in the past 50 years, and the U6 underemployment rate is also at its lowest level, save for one month, since the series began in 1994. Each ticked up by +0.1% in October. In the below graph, both metrics are normed to zero at their lowest levels:
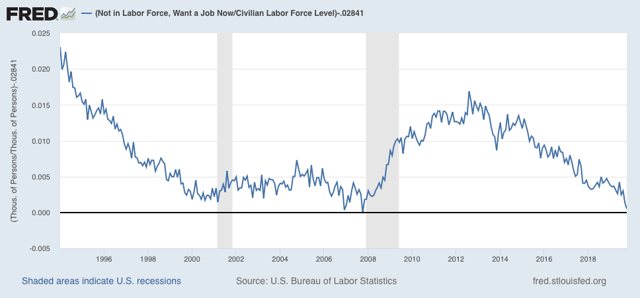
And even beyond that, those who aren’t even in the labor force, but say they want a job now, are less than 0.1% above their lowest level of all in comparison with the total labor force:
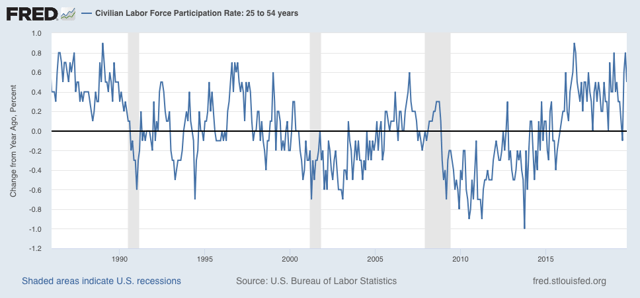
The only remaining weakness, and it is a significant one, is in the area of participation in the labor force. While participation in the labor force in the prime age group (red in the graph below) has jumped by +0.8% from July, and generally since 2017 has had the biggest YoY increases since the last of the baby boomer generation came of age 35 years ago:
During the employment boom of 1996-2001, prime age participation and employment were both as much as 1.6% higher than they are now. In the below graph both prime age labor force participation and the prime age employment-population ratio are normed to zero at their October readings of 82.8% and 80.3% respectively, to show how the present level compares with earlier expansions (prior to 1987, the levels were never as high as presently):
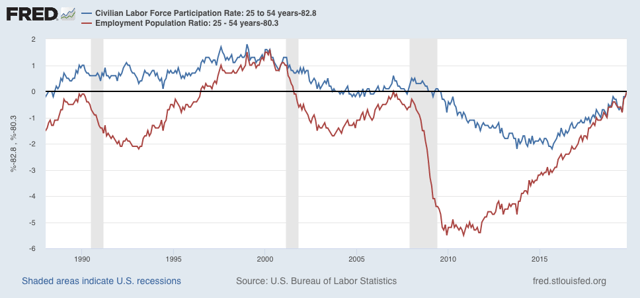
Since the U6 underemployment rate is near record lows, as is the share of people who aren’t even in the labor force at present but say they want a job now, this shortfall is *by definition* people who told the Census Bureau that they *don’t* want a job now — chiefly because of disability or caring for family members (children or parents), in addition to those who are retired.
The reason for this shortfall is probably that wage growth (measured nominally, which is how employers give out raises) remains below that of previous expansions in the past 35+ years:
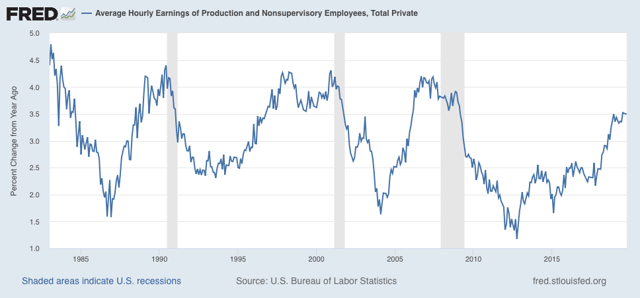
YoY real wage growth is +1.75% as of one month ago, which is pretty good, but is almost entirely driven by changes in the price of gas.
In short, increased wage growth would almost certainly draw more of those on the sidelines into the labor force.