Have we finally reached “full employment”? As I noted on Friday, the household report – the one that tells us about unemployment, underemployment, and labor force participation – was particularly good. In fact, the last two months together have been so good that, at least by some measures, we may finally have arrived at “full employment.” Let’s start with the basics. Gains in employment as measured by the household survey (blue in the graphs below), as opposed to the larger (and, yes, more reliable) payrolls survey (red), were 590,000 and 391,000 in the last two months, respectively. Those were the biggest gains in nearly a year: At 3.5%, that gave us the lowest unemployment rate in the past 65 years (except for a few months in 1968-69): The U6
Topics:
NewDealdemocrat considers the following as important: Taxes/regulation, US/Global Economics
This could be interesting, too:
Joel Eissenberg writes How Tesla makes money
Angry Bear writes True pricing: effects on competition
Angry Bear writes The paradox of economic competition
Angry Bear writes USMAC Exempts Certain Items Coming out of Mexico and Canada
Have we finally reached “full employment”?
As I noted on Friday, the household report – the one that tells us about unemployment, underemployment, and labor force participation – was particularly good. In fact, the last two months together have been so good that, at least by some measures, we may finally have arrived at “full employment.”
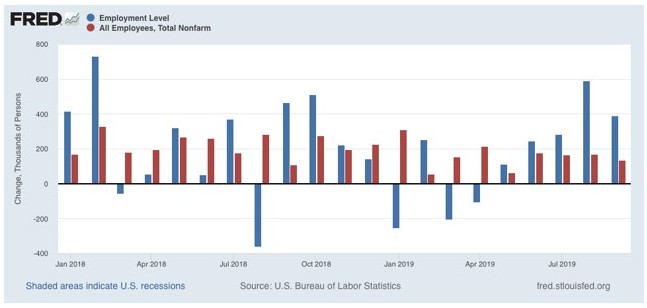
Let’s start with the basics. Gains in employment as measured by the household survey (blue in the graphs below), as opposed to the larger (and, yes, more reliable) payrolls survey (red), were 590,000 and 391,000 in the last two months, respectively. Those were the biggest gains in nearly a year:
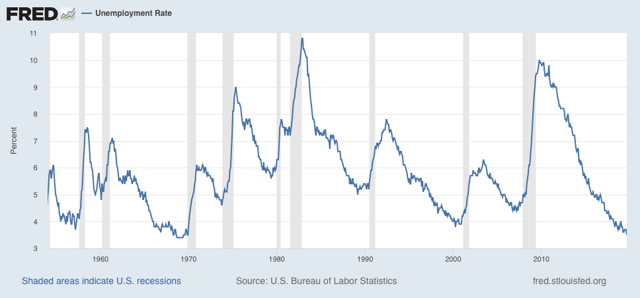
At 3.5%, that gave us the lowest unemployment rate in the past 65 years (except for a few months in 1968-69):
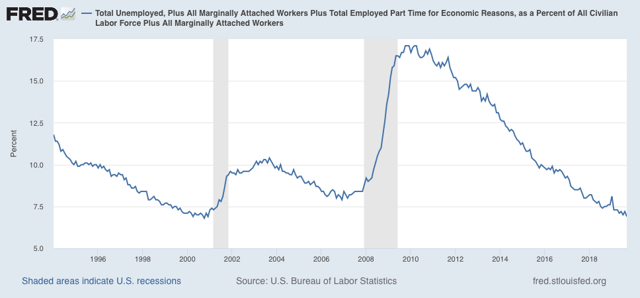
The U6 underemployment rate is also at its lowest level, save for one month, since the series began in 1994:
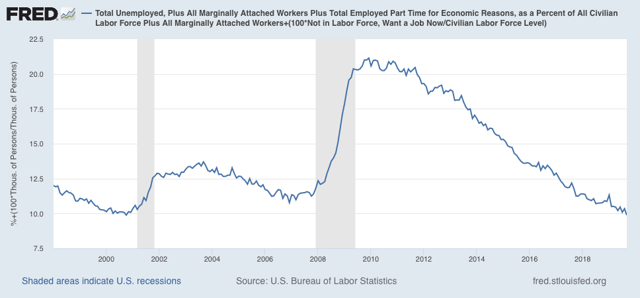
And even beyond that, when we add in those who aren’t even in the labor force, but say they want a job now, we are at the lowest level of all:
By all of the above measures, it certainly looks like we have finally reached “full employment.”
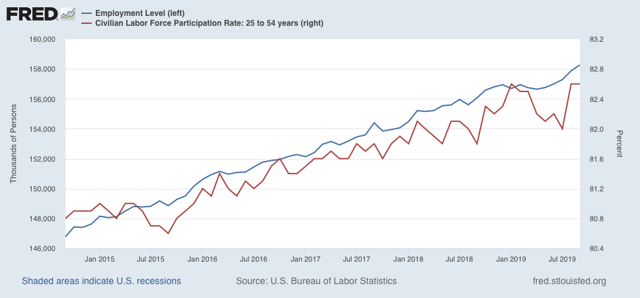
Further, participation in the labor force in the prime age group (red in the graph below) jumped by +0.6% from July, tying its highest rate of this expansion, at 82.6%:
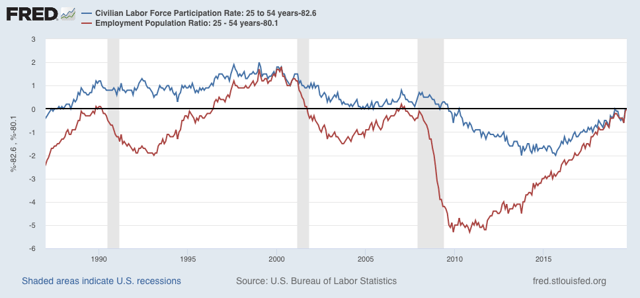
In the below graph, both prime age labor force participation, and the prime age employment-population ratio of 80.1% are normed at the zero level, to show how the present level compares with earlier expansions (prior to 1987, the levels were never as high as presently):
Prime age EPOP is within 0.2% of its highest level in both the 1980s and 2000s expansions. During the boom of the late 1990s, both were significantly higher. Only by that measure are we not now at “full employment.”
The late 1990s was the one time since the 1960s that real wage growth really boomed. I suspect real wages are the reason for both the recent improvement (due to big minimum wage increases in a number of states) and also why participation still lags the 1990s (because real wages haven’t improved enough to lure enough people out of continuing education, or to alter the trade-off of the cost of child care for others).
In summary, I think there is a good argument that we have reached “full employment,” but not “booming employment,” because wage growth is still tepid.

