Political leanings through time for birth cohorts A chart on “political preferences by generation” from Pew Research has been making the rounds in the past few days. Here it is: Figure 1 This chart tells the simplistic story that older generations are more conservative than young ones. It’s considerably misleading. After all, how did the democrats ever win if older generations, who vote in higher percentages, are always more conservative than younger ones? The answer is, it’s not true. Although Pew’s chart does not show the now-passed “greatest generation,” the simple fact is, that generations which came of age during the Great Depression and World War 2, and revered FDR, voted Democratic their whole lives. As I’ve posted before, better way of looking
Topics:
NewDealdemocrat considers the following as important: politics
This could be interesting, too:
Robert Skidelsky writes Lord Skidelsky to ask His Majesty’s Government what is their policy with regard to the Ukraine war following the new policy of the government of the United States of America.
Joel Eissenberg writes No Invading Allies Act
Ken Melvin writes A Developed Taste
Bill Haskell writes The North American Automobile Industry Waits for Trump and the Gov. to Act
Political leanings through time for birth cohorts
A chart on “political preferences by generation” from Pew Research has been making the rounds in the past few days. Here it is:
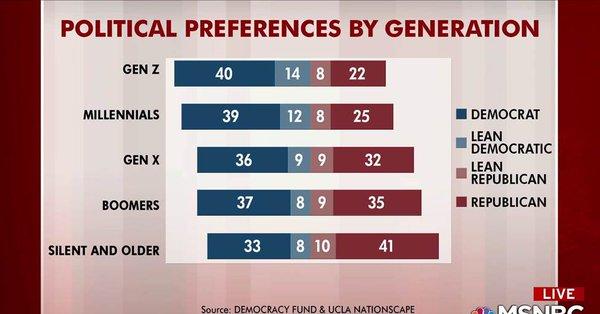 Figure 1
This chart tells the simplistic story that older generations are more conservative than young ones. It’s considerably misleading.
After all, how did the democrats ever win if older generations, who vote in higher percentages, are always more conservative than younger ones? The answer is, it’s not true.
Although Pew’s chart does not show the now-passed “greatest generation,” the simple fact is, that generations which came of age during the Great Depression and World War 2, and revered FDR, voted Democratic their whole lives.
As I’ve posted before, better way of looking at political preferences is to consider who was President during their teenage years. Because people tend to form their basic ideologies in their later teenage, or college years, and stick to it for the rest of their lives.
That is shown by this striking graph, of the evolution of political ideology over time for each birth year, from The Upshot today. The large circles show the ages and voting preferences for each year’s birth cohort as of the last election:

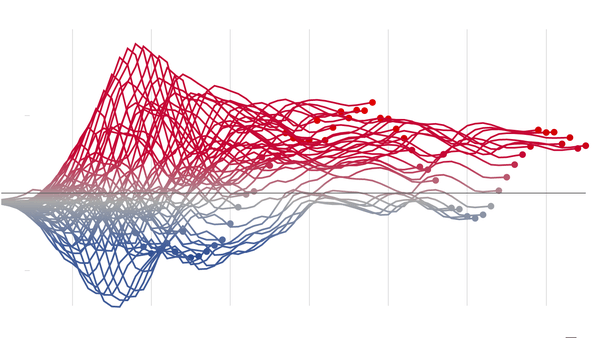
All of a sudden, that inexorable conservative drift with age disappears. Rather, people born during the LBJ and Nixon presidencies shifted ever bluer compared with those born before. Those who formed their ideologies during the unpopular Carter presidency, or during the Reagan years – basically, late Boomers and at the first half of Gen X – became the most conservative of all.
Over the next decade, as the oldest cohort dies off and the blue cohorts who formed their ideologies during the Clinton years and later vote in higher percentages, we can expect the electorate to turn more Democratic. But then, when the blue mid-Boomer contingent passes from the scene, over the next 15-20 years, the most conservative cohort of all, who have always worshipped at the altar of St. Ronnie, will also become the highest voting contingent of all.