Real average and aggregate wages improved in June Now that we have the June inflation reading, let’s finish out our week focusing on the labor market. First of all, nominal average hourly wages in June increased +0.2%, while consumer prices increased +0.1%, meaning real average hourly wages for non-managerial personnel increased +0.1%. Together with upward revisions to prior months, this brings real wages up to 97.2% of their all time high in January 1973: On a YoY basis, real average wages were up +1.6%: On that score, this morning’s readings include this take by Prof. James Hamilton at Econbrowser indicating that the Phillips curve (the trade-off between inflation and employment) is still alive, together with this guest post by David
Topics:
NewDealdemocrat considers the following as important: Taxes/regulation, US/Global Economics
This could be interesting, too:
Joel Eissenberg writes How Tesla makes money
Angry Bear writes True pricing: effects on competition
Angry Bear writes The paradox of economic competition
Angry Bear writes USMAC Exempts Certain Items Coming out of Mexico and Canada
Real average and aggregate wages improved in June
Now that we have the June inflation reading, let’s finish out our week focusing on the labor market.
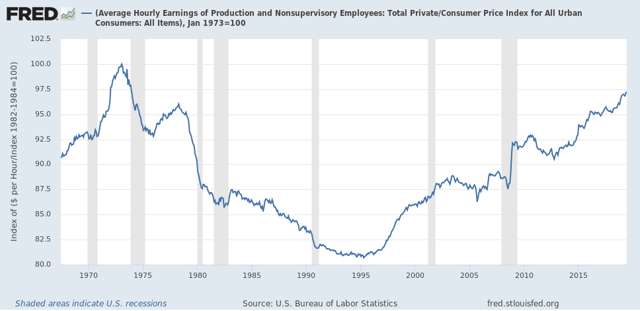
First of all, nominal average hourly wages in June increased +0.2%, while consumer prices increased +0.1%, meaning real average hourly wages for non-managerial personnel increased +0.1%. Together with upward revisions to prior months, this brings real wages up to 97.2% of their all time high in January 1973:
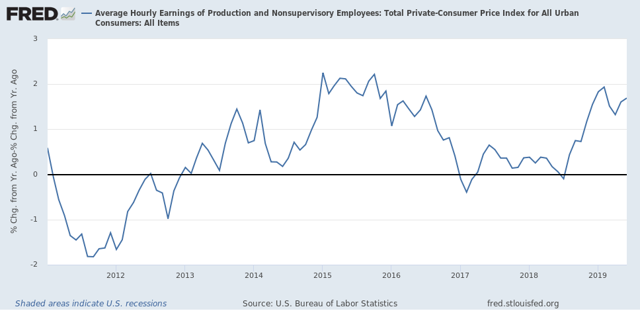
On a YoY basis, real average wages were up +1.6%:
On that score, this morning’s readings include this take by Prof. James Hamilton at Econbrowser indicating that the Phillips curve (the trade-off between inflation and employment) is still alive, together with this guest post by David Branchflower at Talking Points Memo on Jerome Powell’s acknowledgement that the Fed (and many others) failed to appreciate that we were not at full employment in 2016 as they began to raise rates, and stating that the evidence
shows that, now, wage growth is driven not by unemployment but by underemployment, which has still not returned to pre-recession levels. That explains the weak wage growth we see today, and why the U.S. is not yet at full employment.
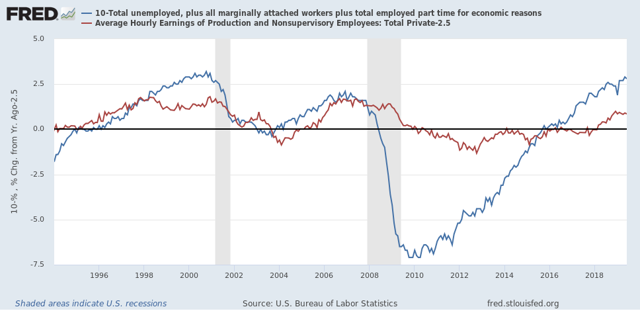
This has been my point of view as well, and it gives me the opportunity to run a graph I haven’t updated in quite awhile – average hourly wages of non-managerial workers (minus 2.5% for easier observation] vs. the U6 underemployment rate [subtracted from 10% so that lower rates show as positives]. This shows that, following recent recessions, underemployment has had to fall below 10% before wage growth stops decelerating:
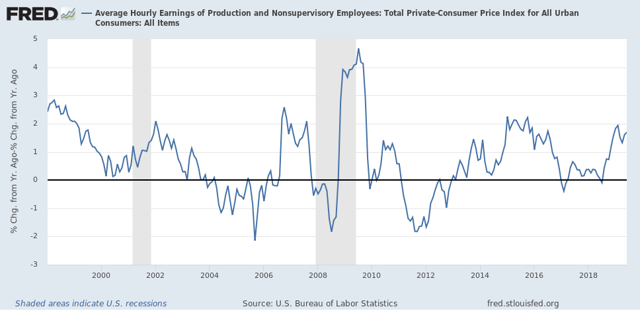
Last month I raised a concern that real aggregate wages had decelerated sharply this year, writing that “[w]hen we take the information in the above graph and chart the YoY% change, we see that real aggregate wage growth has typically decelerated by 1/2 or more from its 12 month peak just at the onset of recessions, although there have been 3 false positives coincident with slowdowns.” Well, with June’s revisions that concern has disappeared for now:
Finally, with the improvement in June, real aggregate wages – the total amount of real pay taken home by the middle and working classes – are up 29.2% from their October 2009 low:
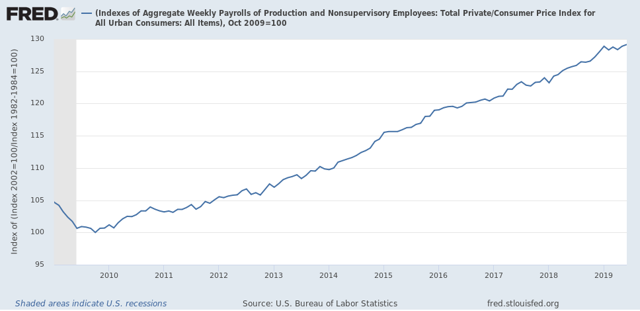
For total wage growth, this expansion is solidly in third place, but behind the 1960s and 1990s, among all post-World War 2 expansions; while the *pace* of wage growth has been the slowest except for the 2000s expansion.
