Real wages got gassed in March The consumer price index rose +0.4% in March, mainly as a result of a big monthly increase in gas prices. That really shouldn’t have been a surprise, since almost every time gas prices have increased by as much as they did in March — up 9% for the month — consumer prices as a whole have gone up at least +0.4%. I’m showing just the last 10 years in the graph below: In fact, ex-gas, consumer inflation ex-energy has been remarkably stable between 1.5% and 2.5% YoY ever since gas prices made their long term bottom in early 1999. The only big exceptions were in the year before each of the last two recessions: As a result of the 0.4% jump in inflation, real wages for non-supervisory employees, which went up +0.3% last
Topics:
NewDealdemocrat considers the following as important: Taxes/regulation, US/Global Economics
This could be interesting, too:
Joel Eissenberg writes How Tesla makes money
Angry Bear writes True pricing: effects on competition
Angry Bear writes The paradox of economic competition
Angry Bear writes USMAC Exempts Certain Items Coming out of Mexico and Canada
Real wages got gassed in March
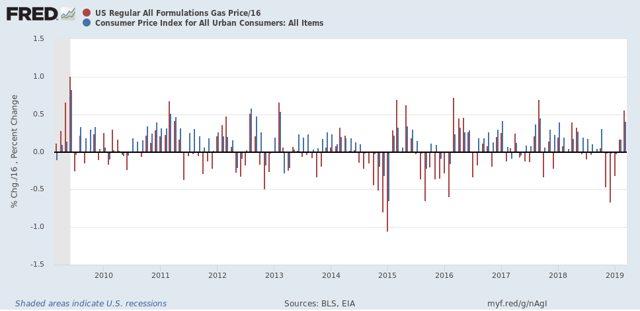
The consumer price index rose +0.4% in March, mainly as a result of a big monthly increase in gas prices. That really shouldn’t have been a surprise, since almost every time gas prices have increased by as much as they did in March — up 9% for the month — consumer prices as a whole have gone up at least +0.4%. I’m showing just the last 10 years in the graph below:

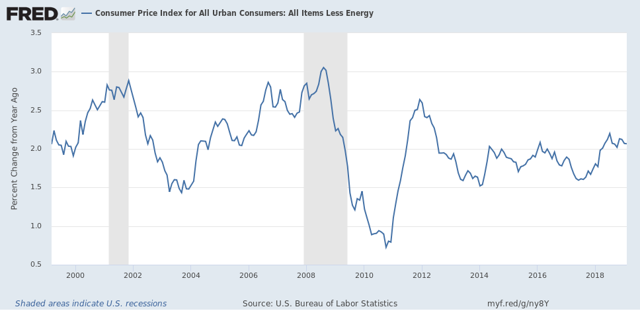
In fact, ex-gas, consumer inflation ex-energy has been remarkably stable between 1.5% and 2.5% YoY ever since gas prices made their long term bottom in early 1999. The only big exceptions were in the year before each of the last two recessions:

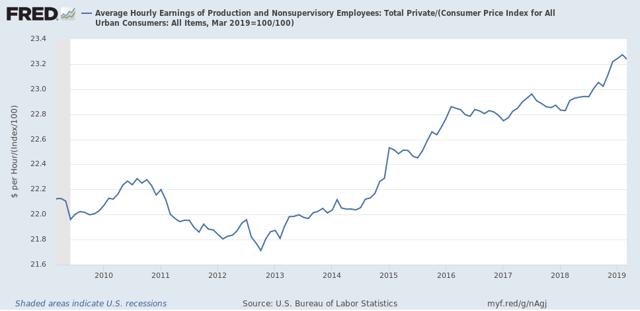
As a result of the 0.4% jump in inflation, real wages for non-supervisory employees, which went up +0.3% last month, actually declined slightly:

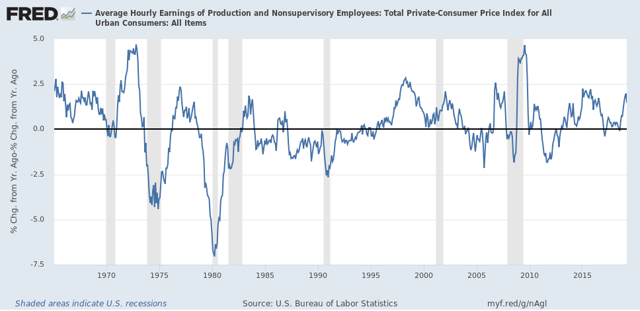
On a YoY% basis, real wages also decelerated slightly, down to +1.4%. Here’s the big picture look going back over 50 years:

Just one month, so not a big deal. Unless gas prices continue to increase at this rate for several more months, in which case headline inflation will be significantly over 2%, and the Fed may feel compelled at very least not to lower rates. In that regard, it’s worth noting that, as shown in the above graph, the typical late cycle pattern over the past 50 years is for wages to increase more than earlier in the cycle, but for the inflation rate to rise even more.
