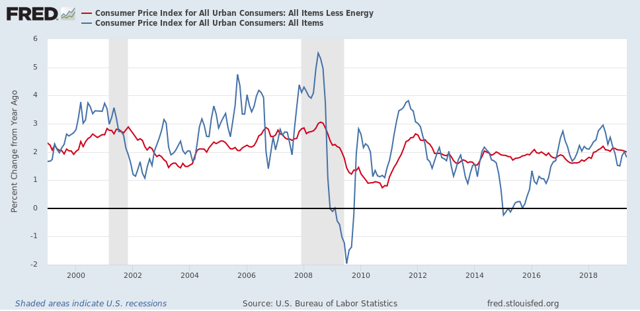
May real wages grow, but real aggregate payrolls on the verge of a red flag warning The consumer price index rose +0.1% in May and declined YoY to 1.8%. Again the main reason was gas prices, which declined in during the month. Below is overall CPI (blue) vs. CPI less energy (red) for the past 20 years: Now let’s turn to wages. Nominally, wages for non-supervisory employees increased +0.3% in May, so after inflation they were up +0.2%, an improvement over the past few months. YoY non-supervisory wages nominally were up +3.2%, which means that real wages for non-supervisory workers are up +1.6%: This was a new 40+ year high, but in the longest view, real wages are still -2.9% below their January 1973 peak: Finally, something important is
Topics:
NewDealdemocrat considers the following as important: US/Global Economics
This could be interesting, too:
Joel Eissenberg writes How Tesla makes money
Angry Bear writes True pricing: effects on competition
Angry Bear writes The paradox of economic competition
Angry Bear writes USMAC Exempts Certain Items Coming out of Mexico and Canada
May real wages grow, but real aggregate payrolls on the verge of a red flag warning
The consumer price index rose +0.1% in May and declined YoY to 1.8%. Again the main reason was gas prices, which declined in during the month. Below is overall CPI (blue) vs. CPI less energy (red) for the past 20 years:
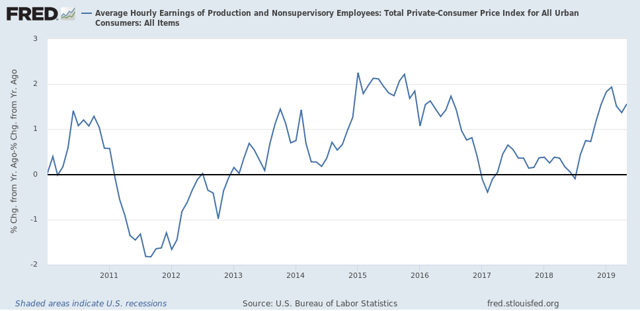
Now let’s turn to wages. Nominally, wages for non-supervisory employees increased +0.3% in May, so after inflation they were up +0.2%, an improvement over the past few months. YoY non-supervisory wages nominally were up +3.2%, which means that real wages for non-supervisory workers are up +1.6%:
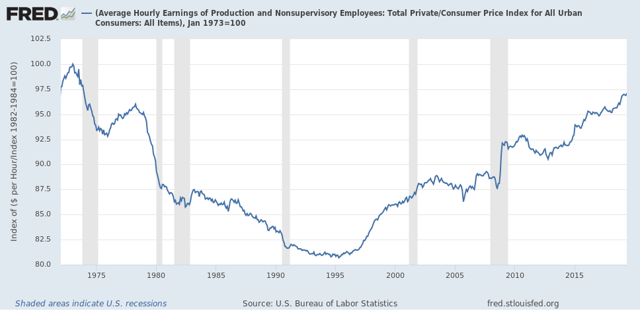
This was a new 40+ year high, but in the longest view, real wages are still -2.9% below their January 1973 peak:
Finally, something important is going on with aggregate real wages. This tells us how much more American workers as a whole in real terms since the bottom just after the Great Recession. These are presently up 28.8% from their post-Great Recession low, but Are -0.1% below their January peak:
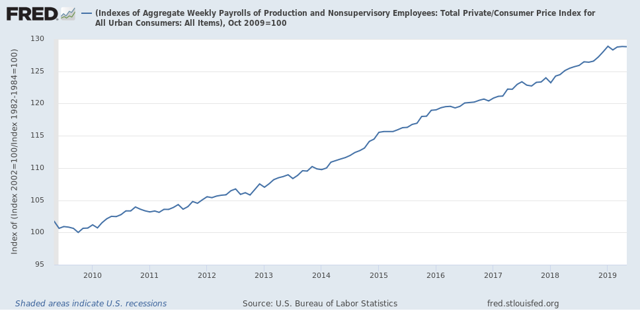
This tells us that, in the aggregate, average Americans have less to spend than they did four month previous, and in that in general this metric has stalled out this year. This is important, because as the below longer term graph shows, real aggregate income has stalled and then started to roll over in the year before almost all recessions in the past 50 years, with the peak usually happening within 6 months of the onset of the recession: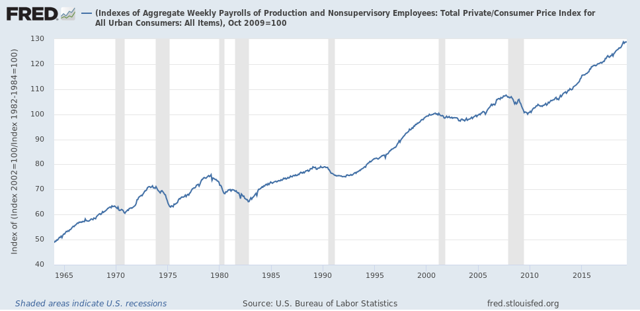
When we take the information in the above graph and chart the YoY% change, we see that real aggregate wage growth has typically decelerated by 1/2 or more from its 12 month peak just at the onset of recessions, although there have been 3 false positives coincident with slowdowns:
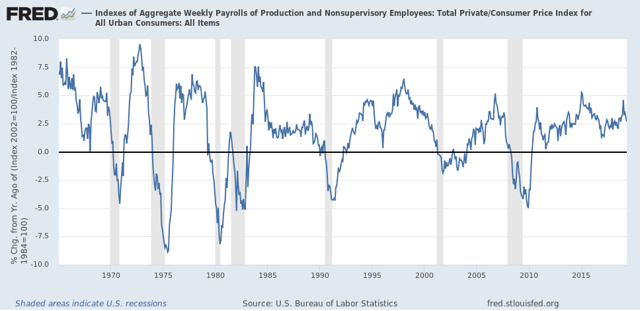
YoY real aggregate payroll growth peaked at 4.6% in January, and is down to 2.6% as of May. Another -0.3% downturn in YoY growth would trigger a red flag recession warning in this signal.
