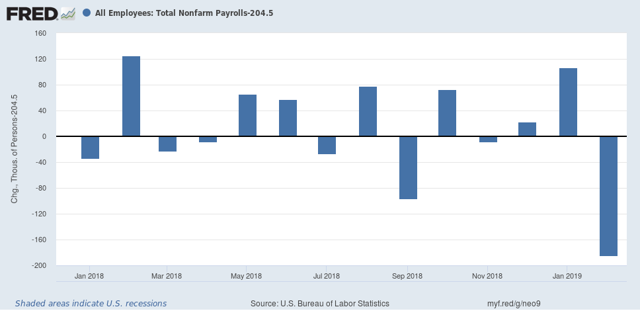
Leading scenes from the February jobs report Let me catch up with some details from last Friday’s employment report. As a preliminary matter, the overwhelming take was that the poor +20,000 gain was “nothing to see here, just an outlier.” The problem with that take is that, for all of 2018, the average monthly gain in jobs was just over +200,000 a month. January came in more than 100,000 above that, at +311,000 jobs, and yet I don’t recall anyone taking the same position, that it was just an “outlier” to the positive side then! Here’s a graph, from which the 2018 average of 204,500 monthly jobs gain has been subtracted, so that the variance from that average shows as positive or negative: So, yes, it’s true that February was a bigger outlier, to the
Topics:
NewDealdemocrat considers the following as important: US/Global Economics
This could be interesting, too:
Joel Eissenberg writes How Tesla makes money
Angry Bear writes True pricing: effects on competition
Angry Bear writes The paradox of economic competition
Angry Bear writes USMAC Exempts Certain Items Coming out of Mexico and Canada
Leading scenes from the February jobs report
Let me catch up with some details from last Friday’s employment report.
As a preliminary matter, the overwhelming take was that the poor +20,000 gain was “nothing to see here, just an outlier.” The problem with that take is that, for all of 2018, the average monthly gain in jobs was just over +200,000 a month. January came in more than 100,000 above that, at +311,000 jobs, and yet I don’t recall anyone taking the same position, that it was just an “outlier” to the positive side then! Here’s a graph, from which the 2018 average of 204,500 monthly jobs gain has been subtracted, so that the variance from that average shows as positive or negative:
Moving on, last week I said to pay attention to three leading sectors of jobs: temporary jobs, construction, and manufacturing. In the past I’ve shown that at least 2 of the 3 sectors contract for a number of months before any recession begins. Here’s what all three sectors look like from January 2018 to the present:
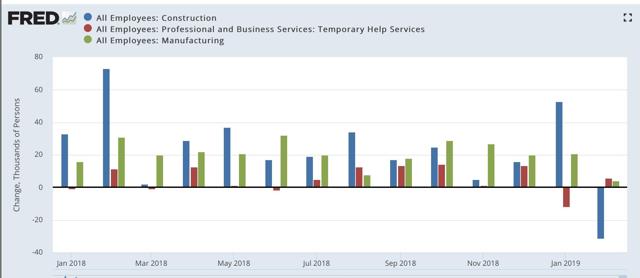
We had a contraction in temp jobs in January, from revisions, and a contraction in construction in February, after an outsized January gain. Manufacturing hung on with a small gain.
Here’s the same information graphed as the YoY% change, first over the past 8 years:
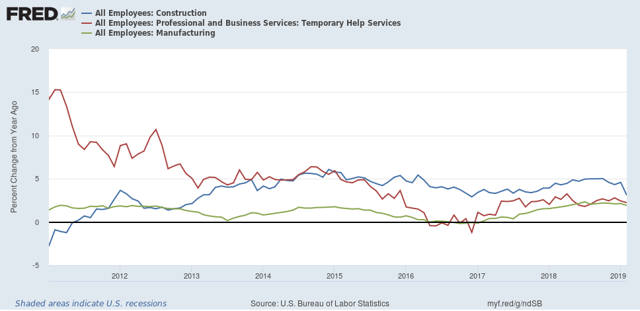
The 2015-16 “shallow industrial recession” clearly stands out as a pocket of weakness.
Now here’s a close-up since the beginning of 2018:
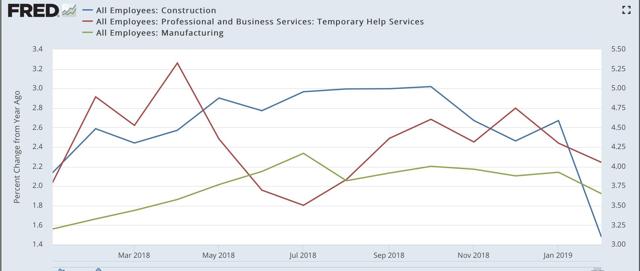
All three show decelerating YoY gains since roughly the beginning of last autumn.
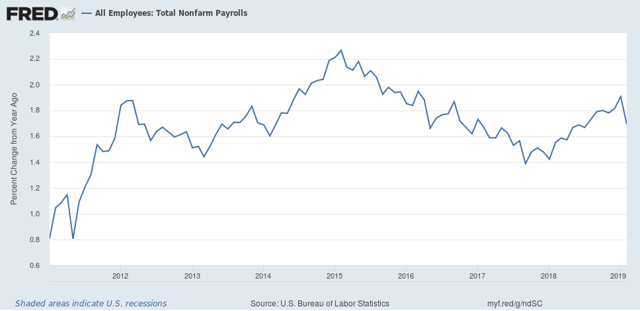
Last week I also said that I expected the YoY pace of job gains to start decelerating. Only one month, of course, but it did do that:
Finally, let’s take a look at two more leading metrics contained in the jobs report.
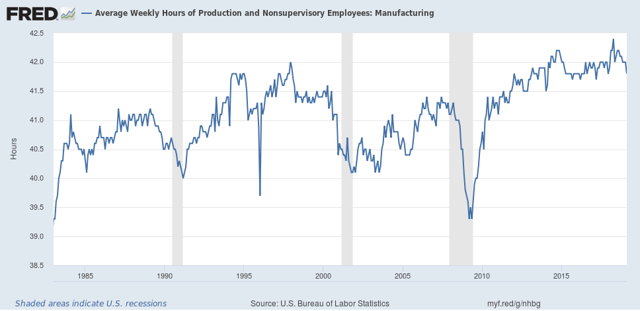
First, the manufacturing work week:
Next, short term unemployment of less than 5 weeks. This is one of the “short leading indicators” listed by Prof. Geoffrey Moore:
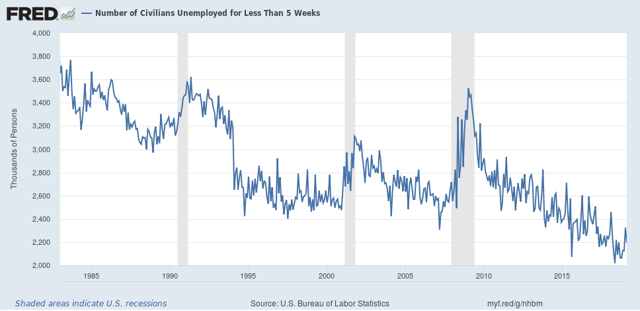
Typically if the three month average is less than 5% above its low, the expansion is intact. If that average is more than 10% above its low, a recession is near or may have just begun. Presently the three month average is 6% above its recent low. Take this with a grain of salt, because it includes the government shutdown month of January.
The bottom line is that, even averaging January with February, all of the leading employment indicators show some deterioration, but none of them are at a point where I would expect them to be if a recession were imminent.
