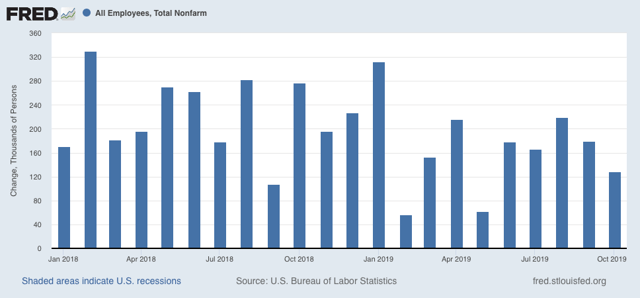
Scenes from the October employment report: leading sectors remain poor Yesterday I discussed unemployment and labor force participation from last week’s jobs report, which with the significant exception that better wage growth would probably lead to more people deciding that they’d like a job, remains very positive. Today let’s look at the bad news, which is the same as last month’s: leading indicators for employment are weak to negative. To begin with, in the last 9 months, per the more reliable establishment report, 1,358,000 jobs have been added, an average of 151,000 per month, including census hiring, a distinct slowdown from 2018’s pace of 205,000: Next, let’s update the three leading sectors of employment that I have been tracking: temporary help
Topics:
NewDealdemocrat considers the following as important: US/Global Economics
This could be interesting, too:
Joel Eissenberg writes How Tesla makes money
Angry Bear writes True pricing: effects on competition
Angry Bear writes The paradox of economic competition
Angry Bear writes USMAC Exempts Certain Items Coming out of Mexico and Canada
Scenes from the October employment report: leading sectors remain poor
Yesterday I discussed unemployment and labor force participation from last week’s jobs report, which with the significant exception that better wage growth would probably lead to more people deciding that they’d like a job, remains very positive. Today let’s look at the bad news, which is the same as last month’s: leading indicators for employment are weak to negative.
To begin with, in the last 9 months, per the more reliable establishment report, 1,358,000 jobs have been added, an average of 151,000 per month, including census hiring, a distinct slowdown from 2018’s pace of 205,000:
Next, let’s update the three leading sectors of employment that I have been tracking: temporary help (blue in the graph below), manufacturing (gold), and residential construction (red). Here’s what they look like compared with 2018, showing the slowdown this year (Note: the big decline in manufacturing last month was the GM strike, which will presumably be reversed in November):
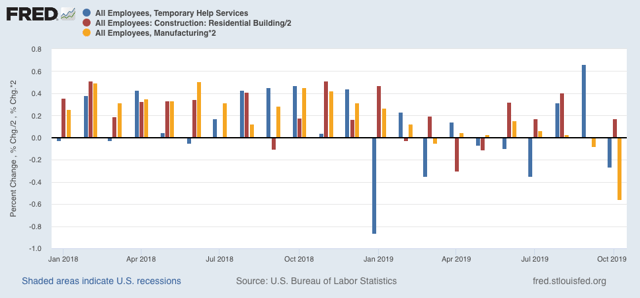
While residential construction may be rebounding a little, don’t be fooled by the better-looking bars for August and September in temporary help. As I have pointed out before, this year there have been almost relentless downward revisions in that number between the initial report and the final one two months later. That pattern held up yet again for August and September. Below are the original number for the last four months on the left, followed by the first and then final revisions to the right:
JUL +2200 -7300* -10,500
AUG +15,400 +14,500 +9,500
SEP +10,200 +20,100 ———*
OCT -8100
*1st revision only
In other words, the net change from the initial September report to the initial October report was -3200.
Further, the average manufacturing workweek is now down 1 full hour per week YoY from its peak. Although I only show data from 1983 onward below, going back 70 years there have only been 2 occasions where such a decline lasted longer than one month without a recession happening (1953 and 1966). In the modern era shown, only in 1985 and 1995 for one month apiece were there 1 hour declines without a recession following:
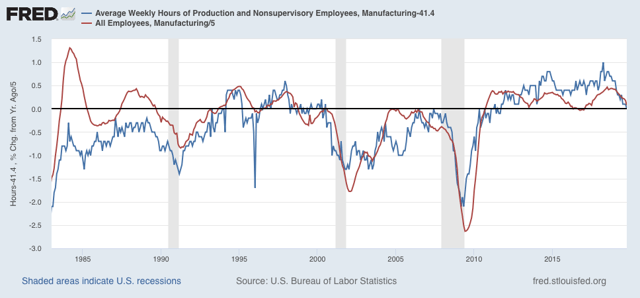
The issue with October’s data is whether this was affected by the GM strike as well. If it was, the number should rebound in November.
A look at the YoY% change in manufacturing hours for the past 35 years shows that such losses have *always* led to actual YoY losses in manufacturing jobs (but only sometimes to recessions):
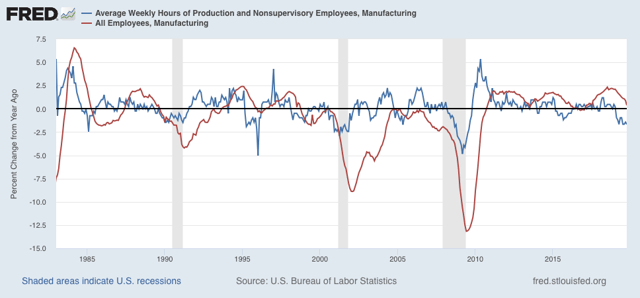
So we should expect more and significant actual losses in manufacturing jobs going forward.
And, like temporary help, the revisions for manufacturing employment have all been downward for the past six months:
APR +4. +3 (-1)
MAY +3 +2 (-1)
JUN +17 +10 (-7)
JUL +16 +4 (-12)
AUG +3 +2 (-1)
SEP -2 -5 (-3)*
OCT -36 (GM strike)
*1st revision only
More broadly, there have been YoY losses in goods-producing jobs before all of the past 3 recessions, and going back 70 years, counting 12 recessions, in all but 3 there has been steep deceleration before and actual losses no later than two months into the recession, with only 2 false positives (1966 and 1985):
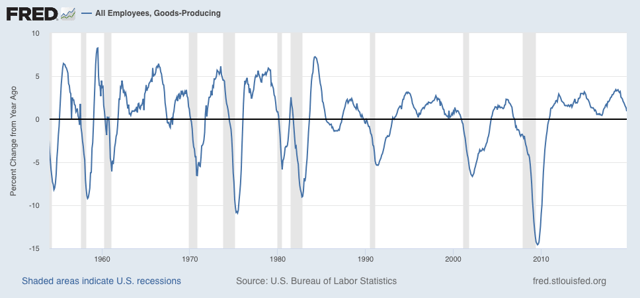
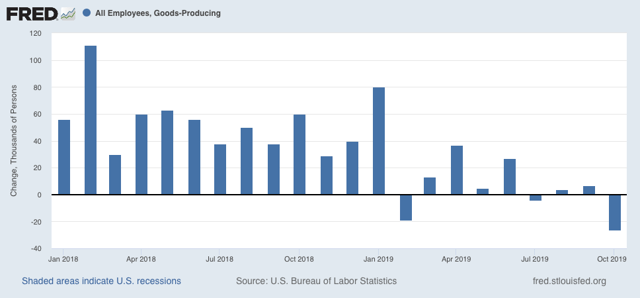
So far this year, only 44,000 jobs have been added in the entire goods-producing sector (again, this may in part reflect the GM strike in October):
This is consistent with at very least a severe slowdown.
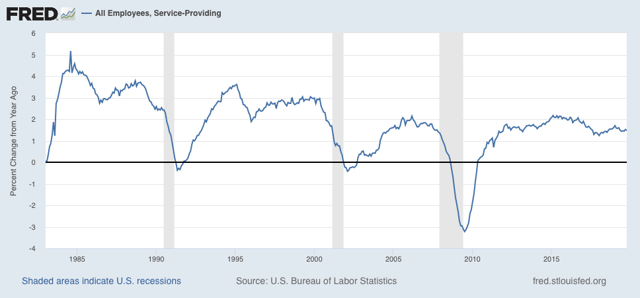
Where there has not been a slowdown is in the (non-leading) services sector, which remains at roughly 1.5% growth YoY:
In summary, to reiterate what I wrote last month, the leading indicators in the employment report strongly suggest that the goods-producing portion of the US economy is probably in a shallow recession right now, and that we should expect further losses in that sector. The economy in general and jobs in particular are being kept in expansion by consistent growth in the services secto