September JOLTS report: mixed with “hard” positives and a “soft” negative This morning’s JOLTS report for September was mixed, with a decline in job openings and an increase in layoffs, but advances in hiring and voluntary quits. To review, because this series is only 20 years old, we only have one full business cycle to compare. During the 2000s expansion: Hires peaked first, from December 2004 through September 2005 Quits peaked next, in September 2005 Layoffs and Discharges peaked next, from October 2005 through September 2006 Openings peaked last, in April 2007 as shown in the below graph(averaged quarterly through Q3): Here is the monthly data for the past five years: As you can see, hires and total separations are at or near their
Topics:
NewDealdemocrat considers the following as important: Uncategorized
This could be interesting, too:
tom writes The Ukraine war and Europe’s deepening march of folly
Stavros Mavroudeas writes CfP of Marxist Macroeconomic Modelling workgroup – 18th WAPE Forum, Istanbul August 6-8, 2025
Lars Pålsson Syll writes The pretence-of-knowledge syndrome
Dean Baker writes Crypto and Donald Trump’s strategic baseball card reserve
September JOLTS report: mixed with “hard” positives and a “soft” negative
This morning’s JOLTS report for September was mixed, with a decline in job openings and an increase in layoffs, but advances in hiring and voluntary quits.
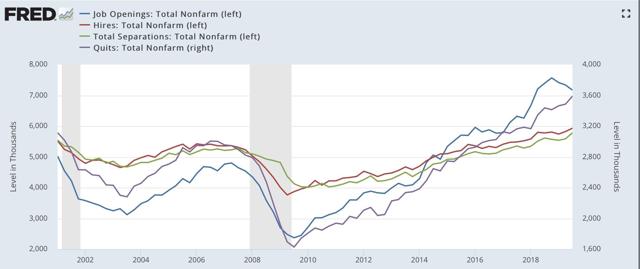
To review, because this series is only 20 years old, we only have one full business cycle to compare. During the 2000s expansion:
- Hires peaked first, from December 2004 through September 2005
- Quits peaked next, in September 2005
- Layoffs and Discharges peaked next, from October 2005 through September 2006
- Openings peaked last, in April 2007
as shown in the below graph(averaged quarterly through Q3):

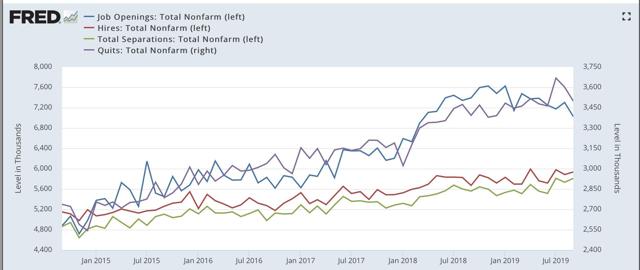
Here is the monthly data for the past five years:

As you can see, hires and total separations are at or near their peaks. Quits have declined in the past two months from their all time high, but are still slightly higher YoY. On the other hand, job openings (which I consider “soft” data) have completely rolled over, and are actually negative YoY.
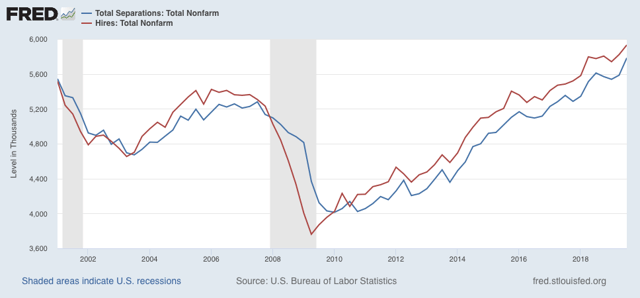
Next, here is the history of the “hiring leads firing” (actually, total separations) metric quarterly through Q3 of this year:

While both hires and fires essentially went sideways in late 2018 and through the first half of this year, in the third quarter, after revisions, both shot up to new highs.
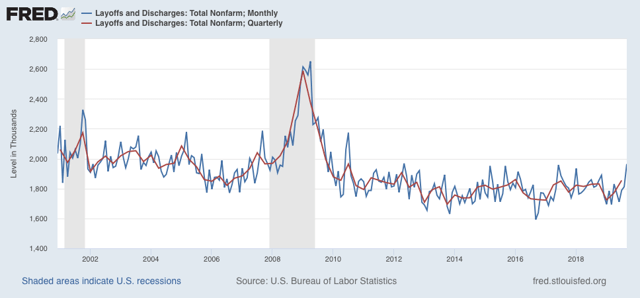
Finally, For completeness’ sake, below are total layoffs and discharges. Note that these turned up appreciably in the six months or so before the Great Recession, with the quarterly average, shown in red, up 15% from its bottom – a similar level of increase that has historically been shown before recessions in YoY initial jobless claims during their lengthier history:

These did sharply increase in September, but the three month average hasn’t increased nearly enough to be a source of concern yet.
One month ago, the deceleration in nearly all metrics had reached neutral levels. With revisions, this month’s “hard” hiring and total separations metrics have resumed a positive trend, while quits are weakly positive, layoffs and discharges are neutral, and only the “soft” job openings metric is negative.
With only one complete previous business cycle to go on, it is difficult to form any judgment from these cross-currents.
