The coming slowdown in employment Last summer I wrote a piece entitled “What the compressed yield curve means for employment.” I re-read it over the weekend, and in light of what has been going on in the bond market, I thought it was worth an update. Let me pretty much re-quote the entire piece: ———— Four times during the 1980s and 1990s the difference in the interest yield between 2 and 10 year treasury bonds got about as low as it is now [Note: i.e., August 2018] (blue in the graphs below). That occurred in 1984, 1986, 1994, and 1998. Even though on none of those 4 occasions a recession followed, on 3 of 4 of those occasions YoY employment gains (red, divided by 2 for scale) subsequently declined: In both 1984 and 1994, YoY employment gains
Topics:
NewDealdemocrat considers the following as important: US/Global Economics
This could be interesting, too:
Joel Eissenberg writes How Tesla makes money
Angry Bear writes True pricing: effects on competition
Angry Bear writes The paradox of economic competition
Angry Bear writes USMAC Exempts Certain Items Coming out of Mexico and Canada
The coming slowdown in employment
Last summer I wrote a piece entitled “What the compressed yield curve means for employment.” I re-read it over the weekend, and in light of what has been going on in the bond market, I thought it was worth an update.
Let me pretty much re-quote the entire piece:
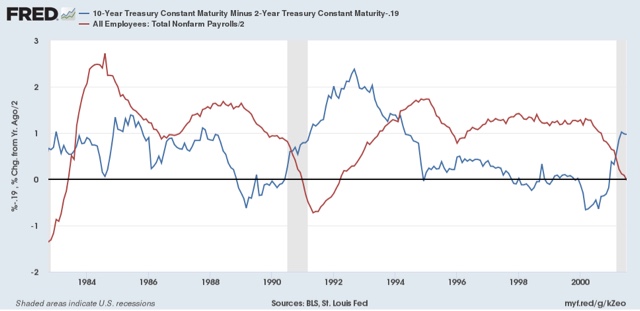
Four times during the 1980s and 1990s the difference in the interest yield between 2 and 10 year treasury bonds got about as low as it is now [Note: i.e., August 2018] (blue in the graphs below). That occurred in 1984, 1986, 1994, and 1998.
Even though on none of those 4 occasions a recession followed, on 3 of 4 of those occasions YoY employment gains (red, divided by 2 for scale) subsequently declined:
In both 1984 and 1994, YoY employment gains peaked within 2 months of the low point in the yield spread. In the 1980s, that decline continued right through and a little beyond the 1986 low in spreads. In both cases YoY gains in employment declined by roughly half. Only in 1998 was there no appreciable effect.
On all 4 of those occasions the Fed lowered interest rates until the economy started to rebound – quickly in the case of 3 of them.
In other words, even if the Fed stops raising rates now [as of August 2018], and the yield curve does not get tighter or fully invert, my expectation is that monthly employment gains will decline to about half of what they have recently been — i.e., to about 100,000 a month — during the next year or so.
——-
– End of quote
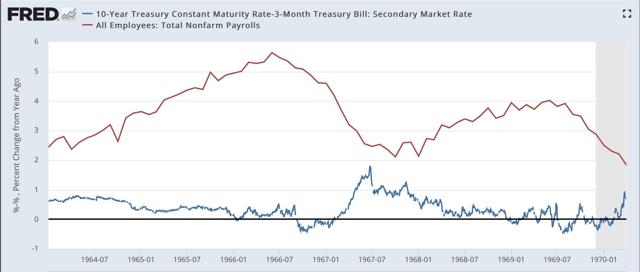
In the last week, I’ve noted that the current yield curve inversion also looks very much like the slowdown of 1966, so let’s look at what happened to employment then as well (note I am using the 10 year vs. 3 month rate, since the 2 year treasury doesn’t go back that far):

YoY employment growth slowed down sharply, from over 5% to just above 2%.
Let me put this in all caps for emphasis: GOING BACK OVER 60 YEARS, ON 12 OF 13 TIMES THAT THE YIELD CURVE WAS AS COMPRESSED AS THIS, OR EVEN JUST NEARLY AS COMPRESSED, EMPLOYMENT GROWTH SLOWED DOWN BY AT LEAST 50% MEASURED YEAR OVER YEAR, INCLUDING BOTH RECESSIONS AND SLOWDOWNS.
Nothing is perfect, but that’s about as tight a correlation as you can get.
Returning to the present, since last August the Fed did not stop raising rates, raising them twice more in September and December. Most of the yield curve – although notably, neither the 2 year vs. 10 year, or 10 year vs. 30 yer ranges – has inverted.
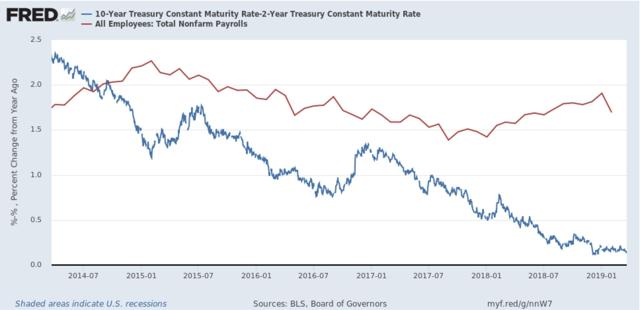
So let’s look at the same comparison of bond spreads and YoY employment for the last five years below:

Even if the Fed starts to lower rates soon, I strongly suspect that January was the YoY peak in employment, and we have started down the road to roughly 100,000/month employment gains – if not worse – later this year.

