A last look at the 2009 – 2020 expansion by New Deal democrat All of the most important economic from February has been reported. Since that was the last month before coronavirus derailed everything, I thought I would take a look back and see what shape the economy was in just before the moment of impact. As usual, the 4 coincident indicators that the NBER usually looks for in determining whether the economy is in expansion or contraction are: industrial production, nonfarm payrolls, real sales, and real personal income minus government transfer receipts. Here’s what they look like through February, with each normed to a level of 100 as of August 2019, first in a longer term view: And now focused on the past year: Note that all 4 flattened or rolled over
Topics:
NewDealdemocrat considers the following as important: Hot Topics, US EConomics
This could be interesting, too:
NewDealdemocrat writes JOLTS revisions from Yesterday’s Report
Joel Eissenberg writes No Invading Allies Act
Bill Haskell writes The North American Automobile Industry Waits for Trump and the Gov. to Act
Bill Haskell writes Families Struggle Paying for Child Care While Working
A last look at the 2009 – 2020 expansion by New Deal democrat
All of the most important economic from February has been reported. Since that was the last month before coronavirus derailed everything, I thought I would take a look back and see what shape the economy was in just before the moment of impact.
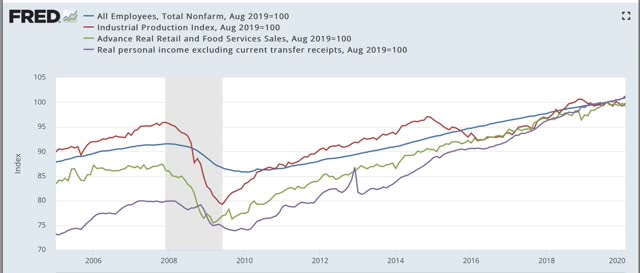
As usual, the 4 coincident indicators that the NBER usually looks for in determining whether the economy is in expansion or contraction are: industrial production, nonfarm payrolls, real sales, and real personal income minus government transfer receipts. Here’s what they look like through February, with each normed to a level of 100 as of August 2019, first in a longer term view:
And now focused on the past year:
Note that all 4 flattened or rolled over at the outset of the 2008 recession. In 2016, production turned down and income flattened, but both jobs and sales continued to increase. In the latter part of 2019 into early 2020, production and sales turned down, but jobs and income continued to increase.
The NBER looks at a broad measure of sales that includes both manufacturing and wholesale sales as well as retail sales (gold in the graph below), but the former are reported with a several month delay. But since the two usually move in tandem, the shallow downturn in real retail sales will probably also show up in the wider measure:
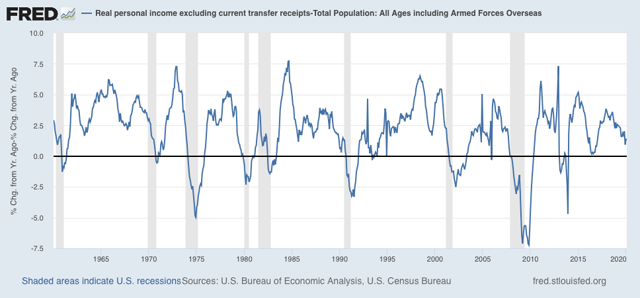
Also, frequently real personal income doesn’t turn down at all during a recession, or turns later than the other three (e.g., 1960, 1970, 1982):
But what it does do is decelerate sharply, especially per capita:
Note that it has not been doing that in the past few months.
On another subject, I have always looked at the housing market as a long leading indicators. In that regard, February single family permits (the least noisy metric) made a new expansion high, and while the much more noisy new home sales decreased slightly, the three month average also made a new expansion high:
Several other long leading indicators, like real money supply and corporate bond rates (not shown) also were very positive.
In summary, just before the coronavirus pandemic almost certainly ended the expansion, it was in a slowdown, but most likely that slowdown was not severe, and was not going to turn into a recession, as the leading indicators had indicated improvement in the second half of this year.
Once we have more visibility as to the course of the pandemic, it will be worthwhile to look at the short and long leading indicators again to see what the economy is likely to look like thereafter.


