(Dan here…NDd’s post points to more than the impact of the US catching up in testing only recently, but also points to beginning answers readers have asked in comments about what the statistics show regarding re-opening and where we might be failing to report. ) Coronavirus dashboard: emphasis on testing I want to focus this edition on testing issues. While the seven day average number of deaths continues to decline: The seven day average number of new infections has leveled off: The average number of daily tests *may* also be leveling off again in the past few days: What is worse is that the number of new cases in the US has only declined -22% from its peak in the last 45 days. Meanwhile, even hard hit countries in Europe like Spain have seen a
Topics:
NewDealdemocrat considers the following as important: Healthcare, politics, US/Global Economics
This could be interesting, too:
Robert Skidelsky writes Lord Skidelsky to ask His Majesty’s Government what is their policy with regard to the Ukraine war following the new policy of the government of the United States of America.
Joel Eissenberg writes No Invading Allies Act
Ken Melvin writes A Developed Taste
Bill Haskell writes The North American Automobile Industry Waits for Trump and the Gov. to Act
(Dan here…NDd’s post points to more than the impact of the US catching up in testing only recently, but also points to beginning answers readers have asked in comments about what the statistics show regarding re-opening and where we might be failing to report. )
Coronavirus dashboard: emphasis on testing
I want to focus this edition on testing issues.
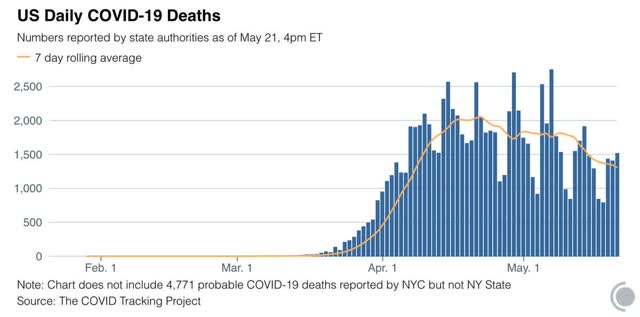
While the seven day average number of deaths continues to decline:
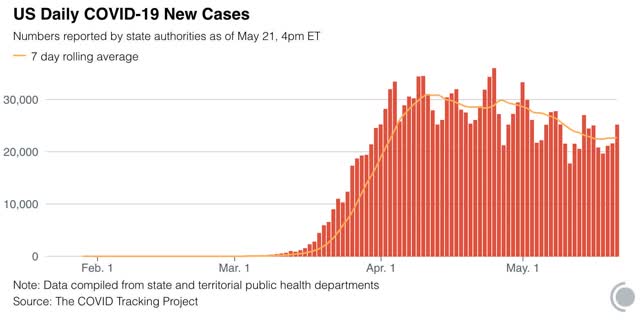
The seven day average number of new infections has leveled off:
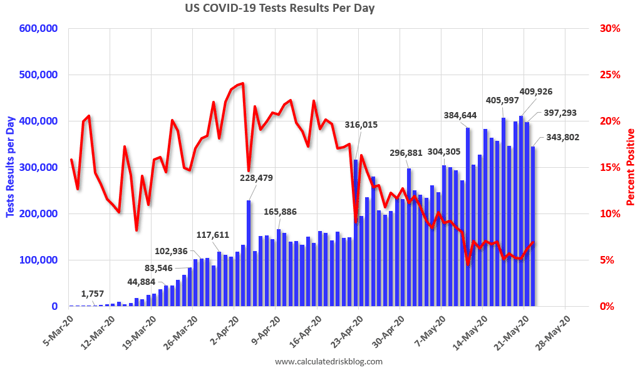
The average number of daily tests *may* also be leveling off again in the past few days:
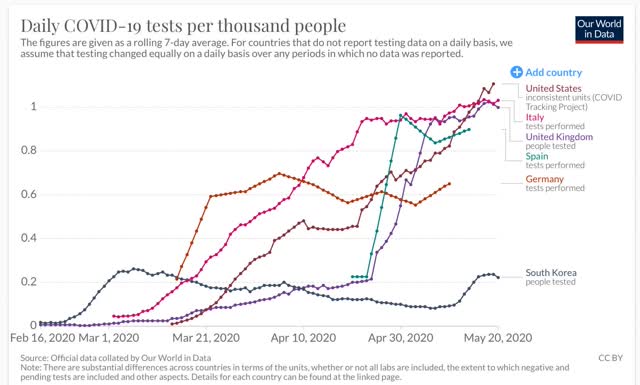
What is worse is that the number of new cases in the US has only declined -22% from its peak in the last 45 days. Meanwhile, even hard hit countries in Europe like Spain have seen a -90% decline from peak in new cases over a similar timeframe:
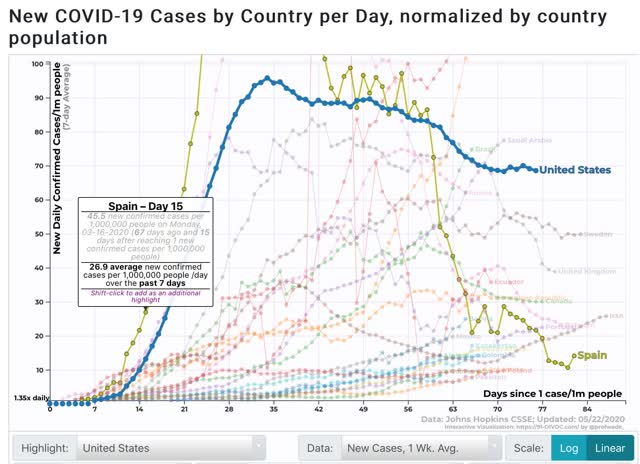
Even hardest-hit Belgium has had a -80% decline from peak (not shown).
The pessimistic explanation for this is that the US’s response, on the whole, has always been half-hearted at best. That may be the case, and at very least it is part of the explanation.
The more optimistic explanation – and I think this is the main part of the answer – comes back to a poor level of testing.
As I pointed out yesterday, in the matter of testing the US started late, with an abominably low number of tests in March and early April, and only in the past week to 10 days equaled and finally slightly surpassed the level of testing per capita in comparable countries in Western Europe:
On a cumulative basis, the US comes in dead last for per capita number of tests administered (We’re number 178!!!)(column at far right):
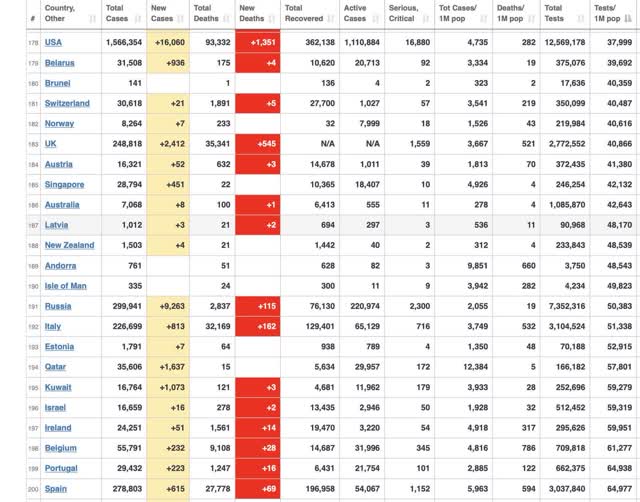
Altogether the US had administered 38,000 tests per million people, while Italy has tested 51,000, Belgium 61,000, and Spain 65,000.
A study of 366 US counties just published by the Surgo Foundation indicates that the US has probably missed 40,000 deaths or more, especially in rural counties, by its failure to diagnose infections:
Our data suggest that we may be especially undercounting COVID-19 deaths in Southern parts of the US. In more than 200 of the counties we examined, excess death rates were between two times to 30 times higher than reported COVID-19 death rates.
On average, excess death rates are 30% higher than reported COVID-19 death rates.
Here’s a graph from the study showing the trend:
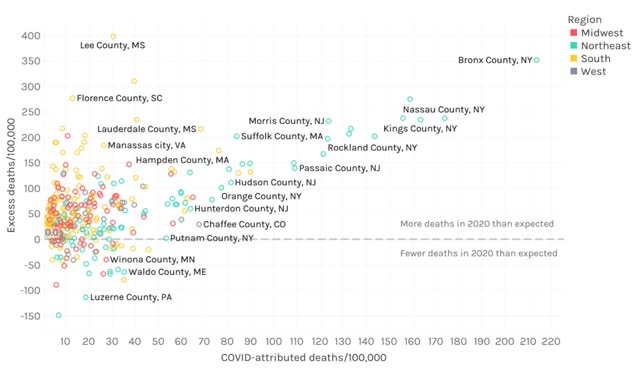
In general, the higher the rate of coronavirus infection, the higher percentage of deaths that have been missed. Further, note the above is deaths only, not even total diagnoses. Probably the number of diagnoses missed has been about 5x or more the number of deaths missed.
In short, in March and April the US was missing a huge share of coronavirus infections, that have been increasingly picked up since testing increased beginning in late April.
If you go back and take a look at the fourth graph in this post above (comparing US cases per capita with Spain), you can see that there was a similar leveling off in the number of new cases during the middle portion of April just after a big increase in testing. I suspect that the current leveling off in new cases primarily reflects that the US as a whole finally ramped up testing enough to catch these cases.
The silver lining is that about half of the US is probably near, if not at, the point where it is performing enough tests to begin transitioning to a “test, trace, and isolate” regimen. Here’s a graph from The Johns Hopkins University’s Coronavirus Resource Center, making use of the WHO‘s recommended positivity rate of 5% or below for 14 days before implementing a “test, trace, and isolation” regimen, indicating that 26 US States and territories have reached that point in testing. The other 26 have not:
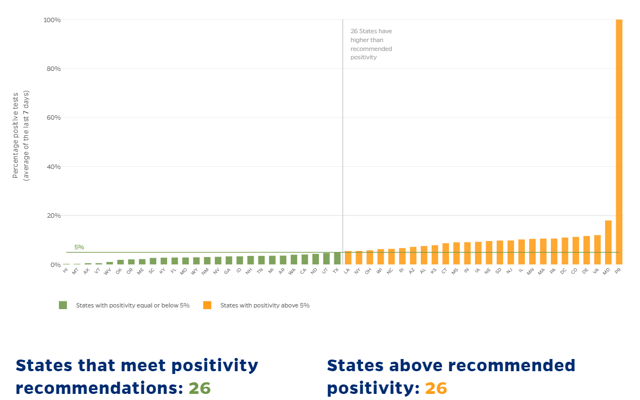
The huge spike at the right end of the graph is Puerto Rico, which is an order of magnitude off the number of tests that need to be performed, followed by Maryland.
It will probably take about another week to see if the trend in new cases starts to decrease again, or whether the reckless “reopening” of many States begins to show up in a second wave of new infections.